Sound lab
Pitch, loudness and syllable length in recordings of Greek verse, alongside your own voice.
6. Sound lab · 1 of 7
Seeing a voice
A recording can be turned into a picture. The picture shows, moment by moment, how loud the voice is, how high it is, and which vowel or consonant it is making. Every picture on this page also plays. Press the play button under it, or click anywhere on the picture, and a thin line moves across it in time with the sound.
The recordings are the site’s own. One is David Chamberlain’s reading of the opening of the Iliad, a human voice reading in a restored ancient pronunciation. The others are the synthetic tracks that the site uses to sing its examples. A synthetic track is made by a computer from the written text, so it shows a model of the accent, not evidence for it.
The program behind the pictures
The pictures were made with Praat. Praat is a free program for analysing speech, written by Paul Boersma and David Weenink at the University of Amsterdam.[1] Phoneticians all over the world use it to measure recordings. Here it was run through parselmouth, which lets the Python programming language call Praat directly.[2]
This tab explains what the pictures show. The next tab follows Chamberlain through the first two hundred lines of Iliad 1, line by line. The tabs after it compare other readers, measure the pitch accent and the length of syllables, and let you record your own voice.
Five rows in every picture
Measured Each picture has the same five rows, from top to bottom.
- Syllables. The top row is a strip of labels. Each label is one syllable of the scansion, with its long or short sign, placed over the stretch of sound it occupies. For the synthetic tracks the times are exact, because the site made the sound. For Chamberlain they were measured.
- Waveform. The waveform is the pressure of the air as it changes from moment to moment. Loud vowels are the wide parts. A stop such as [p] or [t] shows as a short gap, because the mouth is closed for a moment. A hissing sound such as [s] is a dense, narrow fuzz.
- Spectrogram. In a spectrogram, time runs from left to right and frequency from bottom to top. The darker a spot, the more energy the sound has at that frequency at that moment.[3] The pictures here use a short analysis window of 5 milliseconds, which gives what is called a broad-band spectrogram.[4] In a broad-band spectrogram the dark horizontal bands are the formants. Formants are the resonances of the mouth and throat, and they are what makes one vowel sound different from another. The coloured dots are Praat’s estimates of the first three formants, which are called F1, F2 and F3.
- Pitch. This row shows the fundamental frequency, written F0. F0 is the number of times a second that the vocal folds open and close, and the ear hears it as how high the voice is. Praat finds it by autocorrelation: it compares the sound with copies of itself shifted by different amounts, and keeps the shift that matches best.[5] This is the row that matters most here, because the Greek accent was a pitch accent. A pitch accent is an accent made by raising the voice, not by making the syllable louder or longer.[6] The scale is logarithmic, because the ear hears pitch as ratios. A fifth, for example, is the ratio 3 : 2 wherever it starts.
- Intensity. The bottom row shows the intensity in decibels, which is how loud the voice is from moment to moment. A stress accent shows in this row and in the length of the syllable, but a pitch accent need not show here at all.[7] Whether the Greek accent also changed the loudness of the voice is one of the questions of the Accent page.
How to play a picture
Press ▶ under a picture to hear it, and press again to pause. A line moves across all five rows while the sound plays. Click or tap any point of the picture to play from that moment. With a keyboard, move to the picture with the Tab key. Then Space plays or pauses, the left and right arrows step back or forward by half a second, and Home returns to the start.
Chamberlain, Iliad 1.1
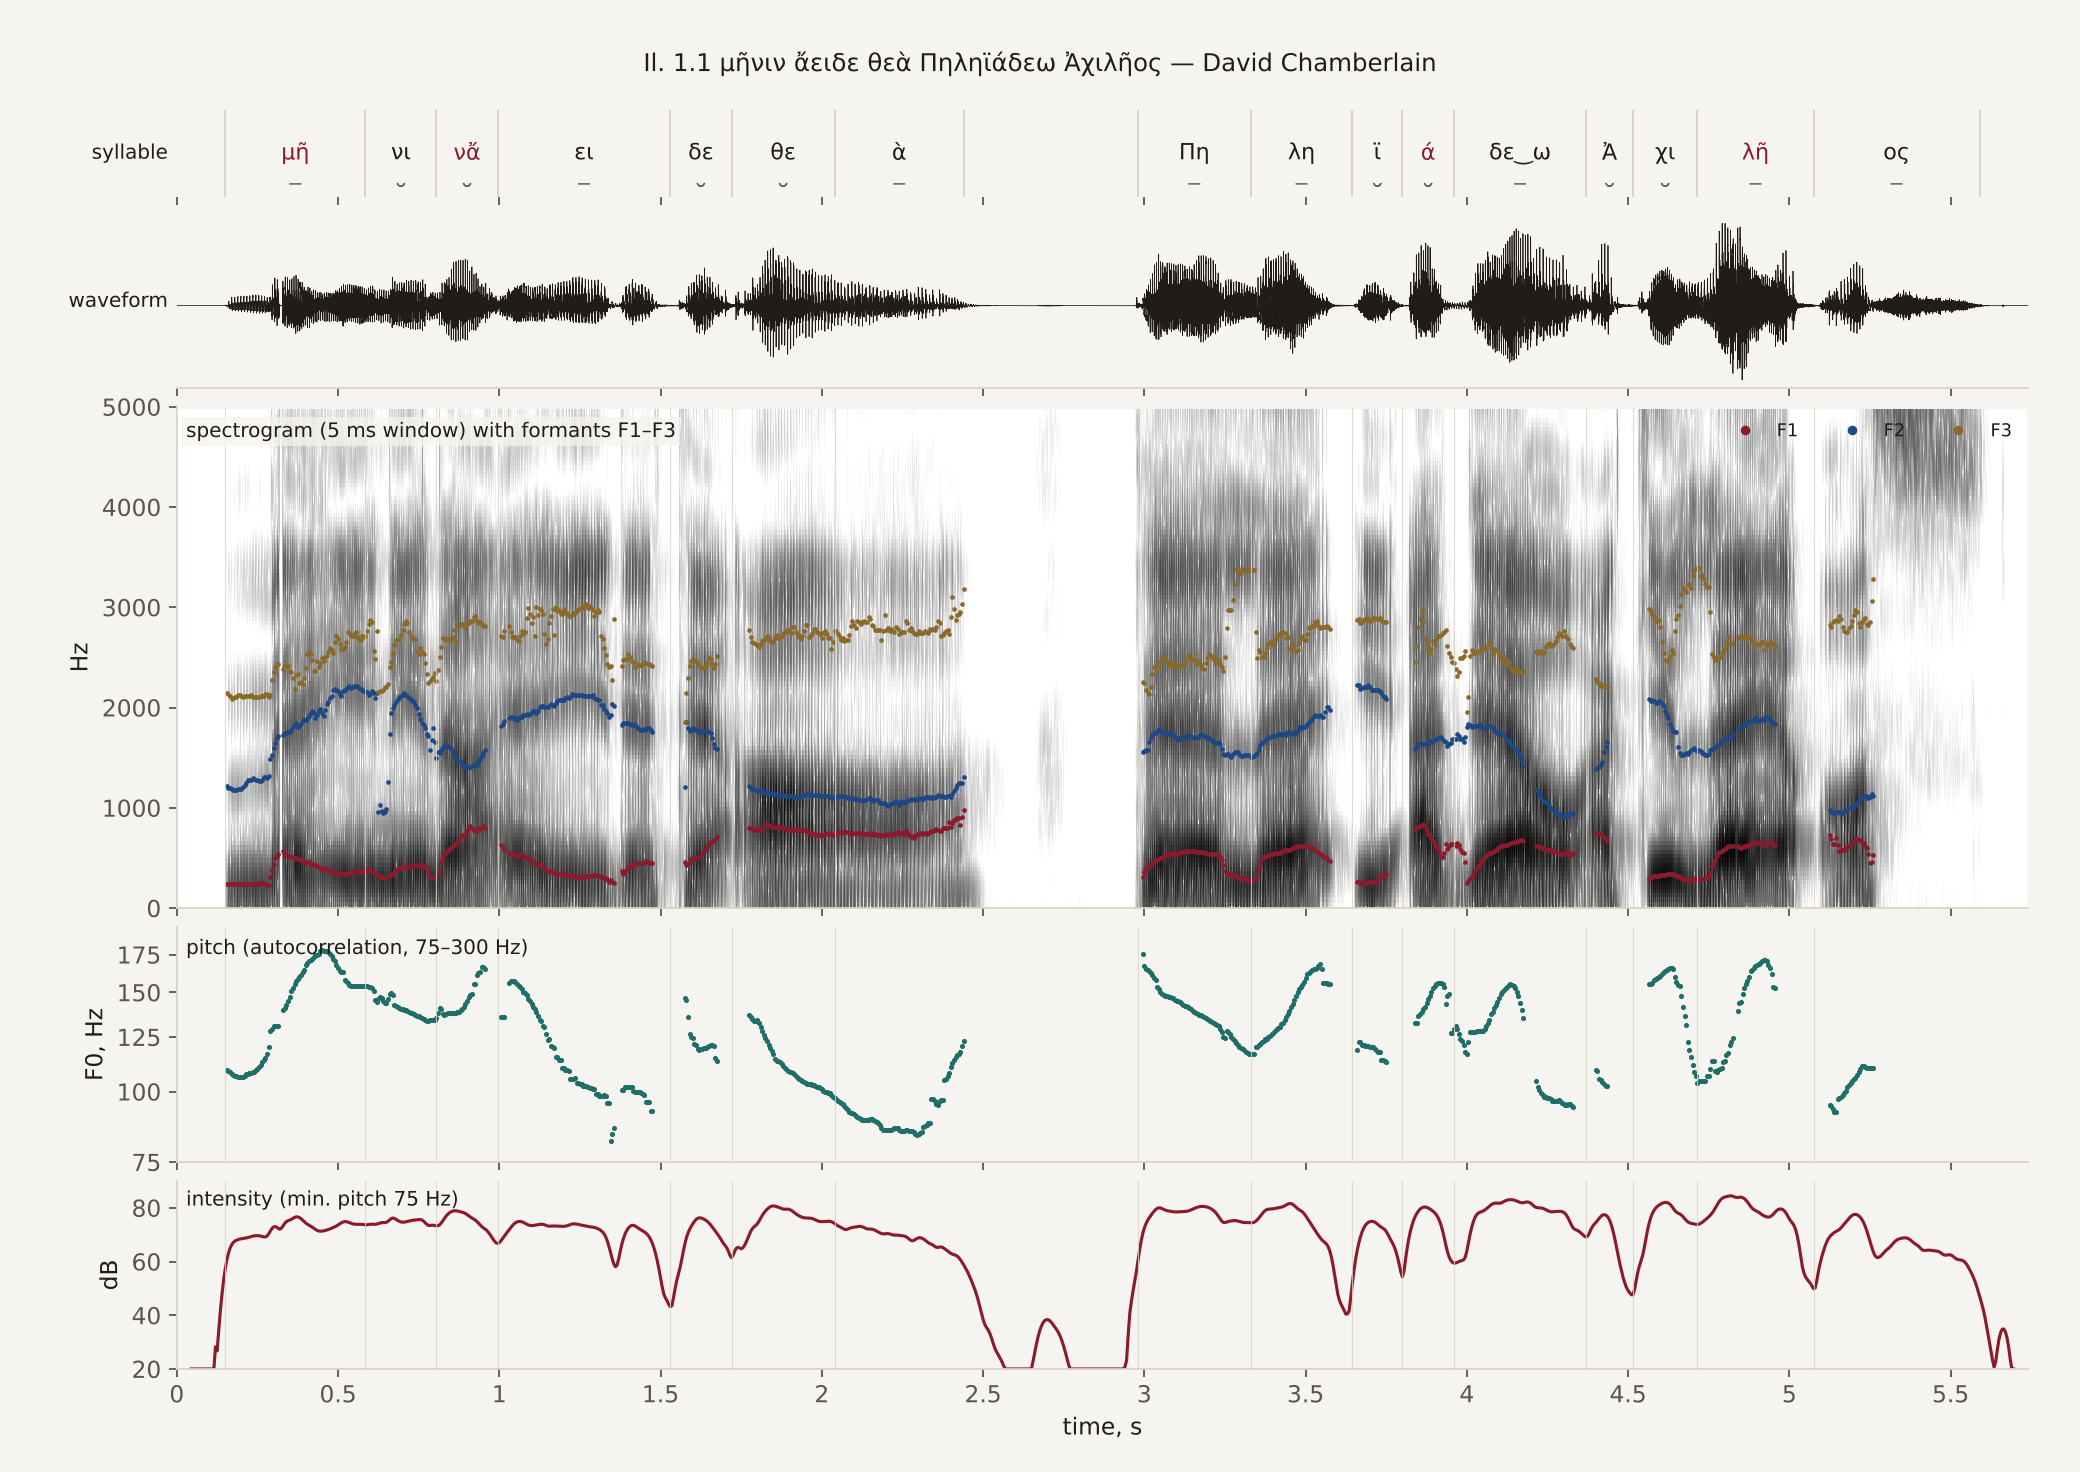
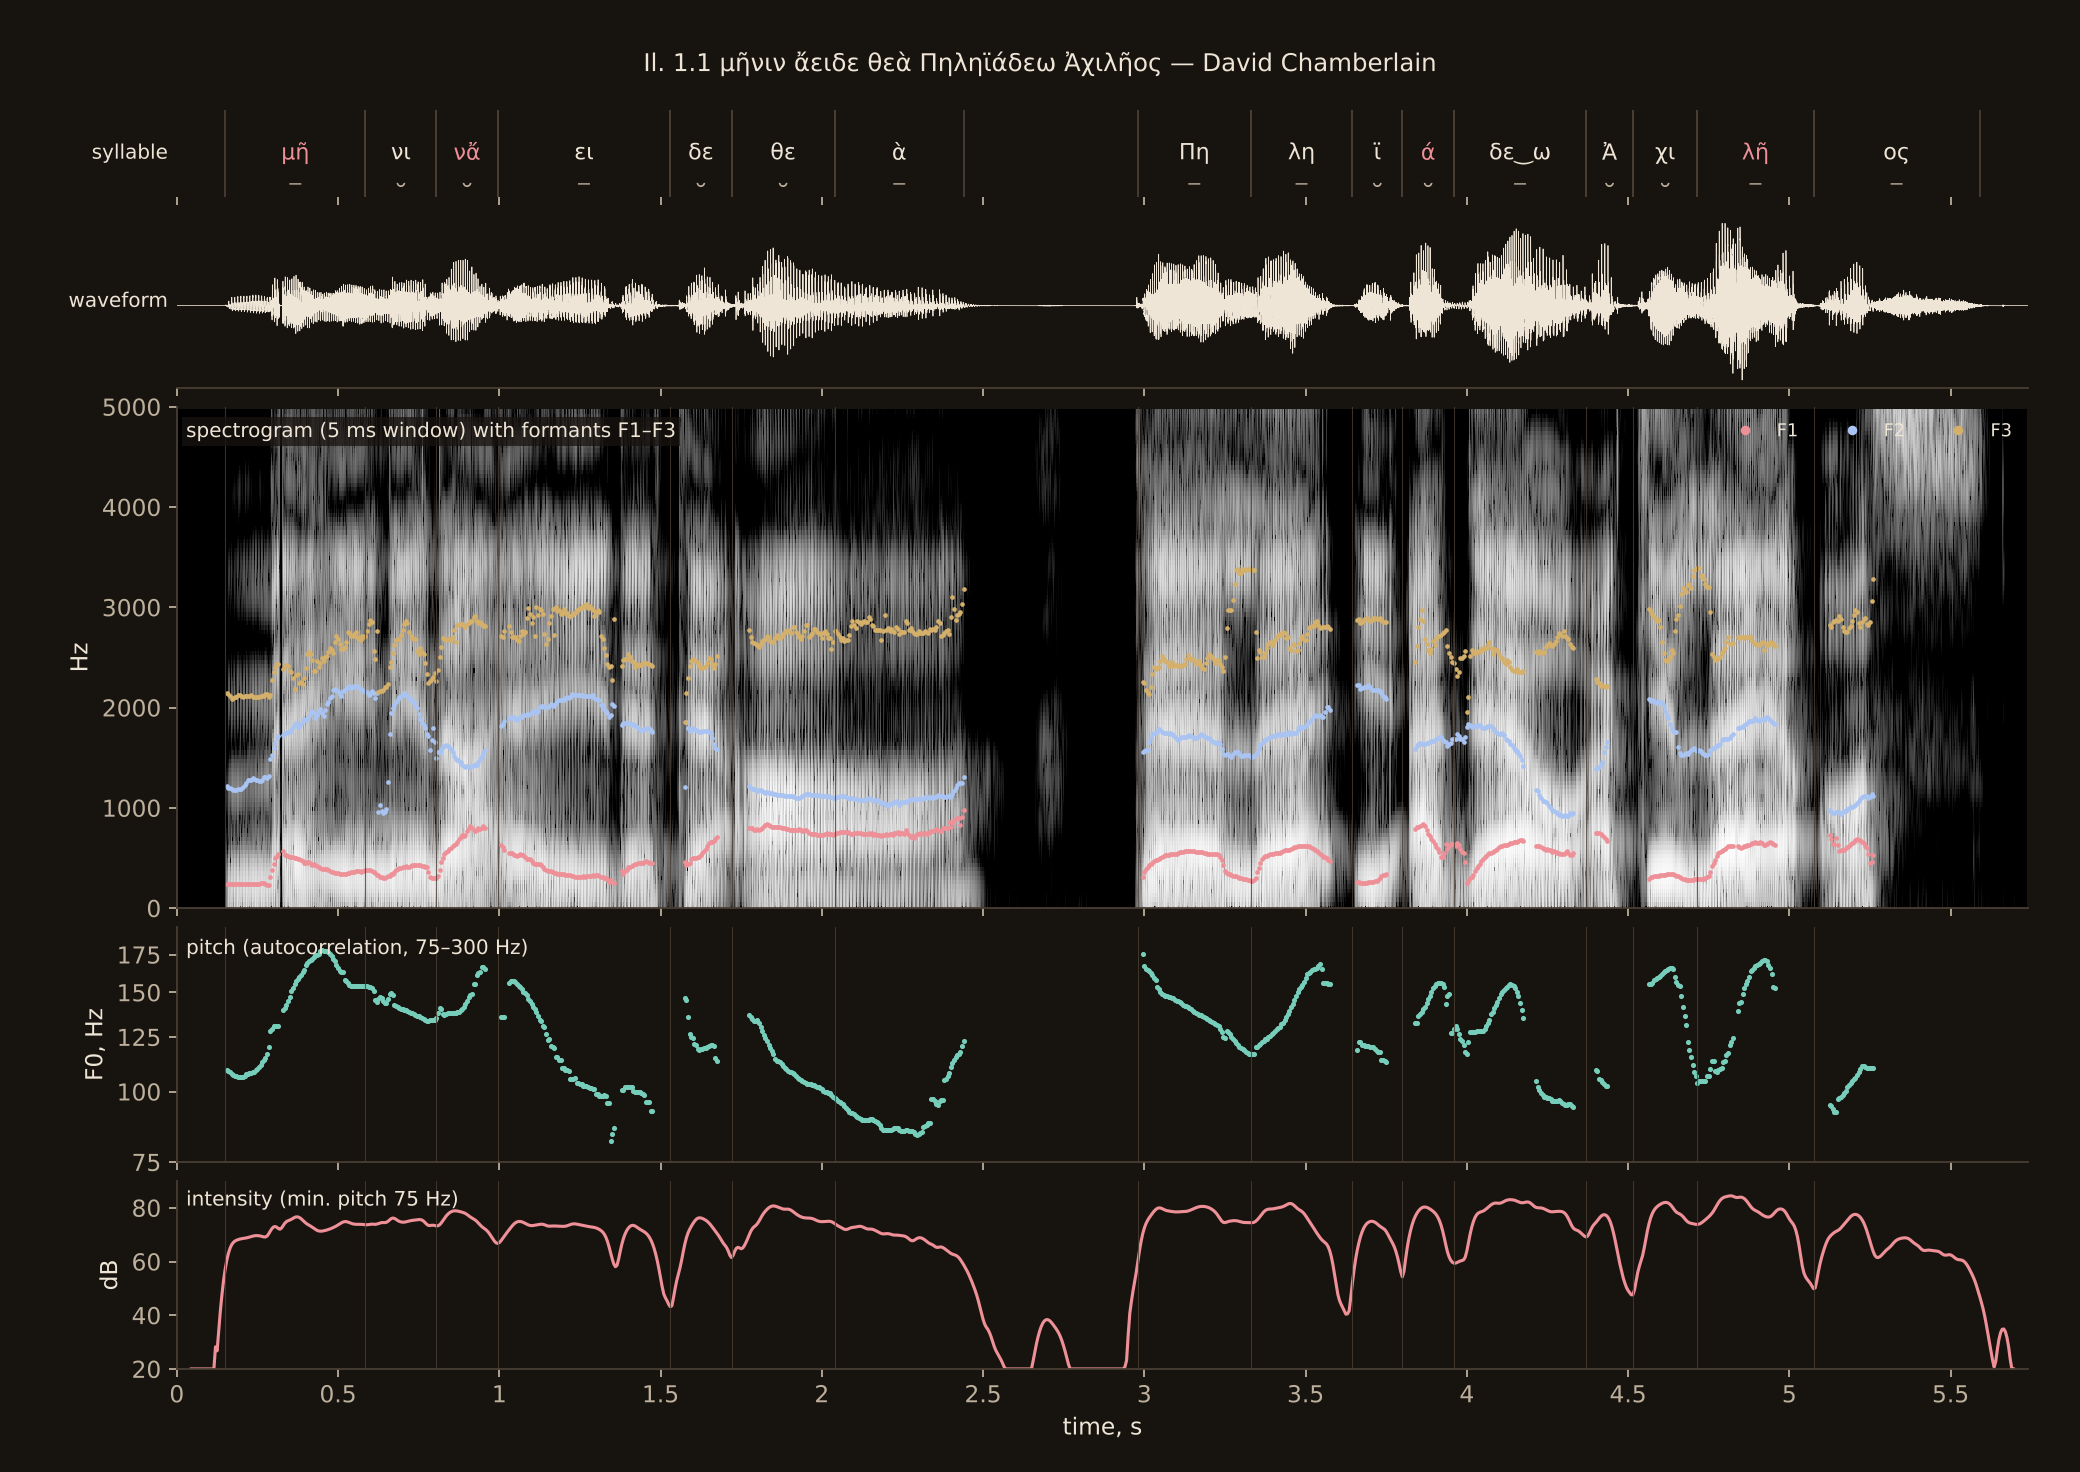
Three things are worth watching. First, the reader’s voice covers a wide range. Over the first 52 lines his syllables span about fourteen semitones, from the 5th to the 95th centile, as the Pitch accent tab measures. That is twice the fifth, seven semitones, that Dionysius of Halicarnassus allows to the melody of speech.[8] The accented syllables sit higher than the unaccented ones on average, but not every one does.
Second, the pitch moves in glides, not in steps. Speech glides from one pitch to the next, while singing moves by fixed intervals.[9]
Third, the intensity stays within about 10 dB across the line, except at the pause. The movements of pitch are not matched by movements of loudness.
The synthetic Sappho track
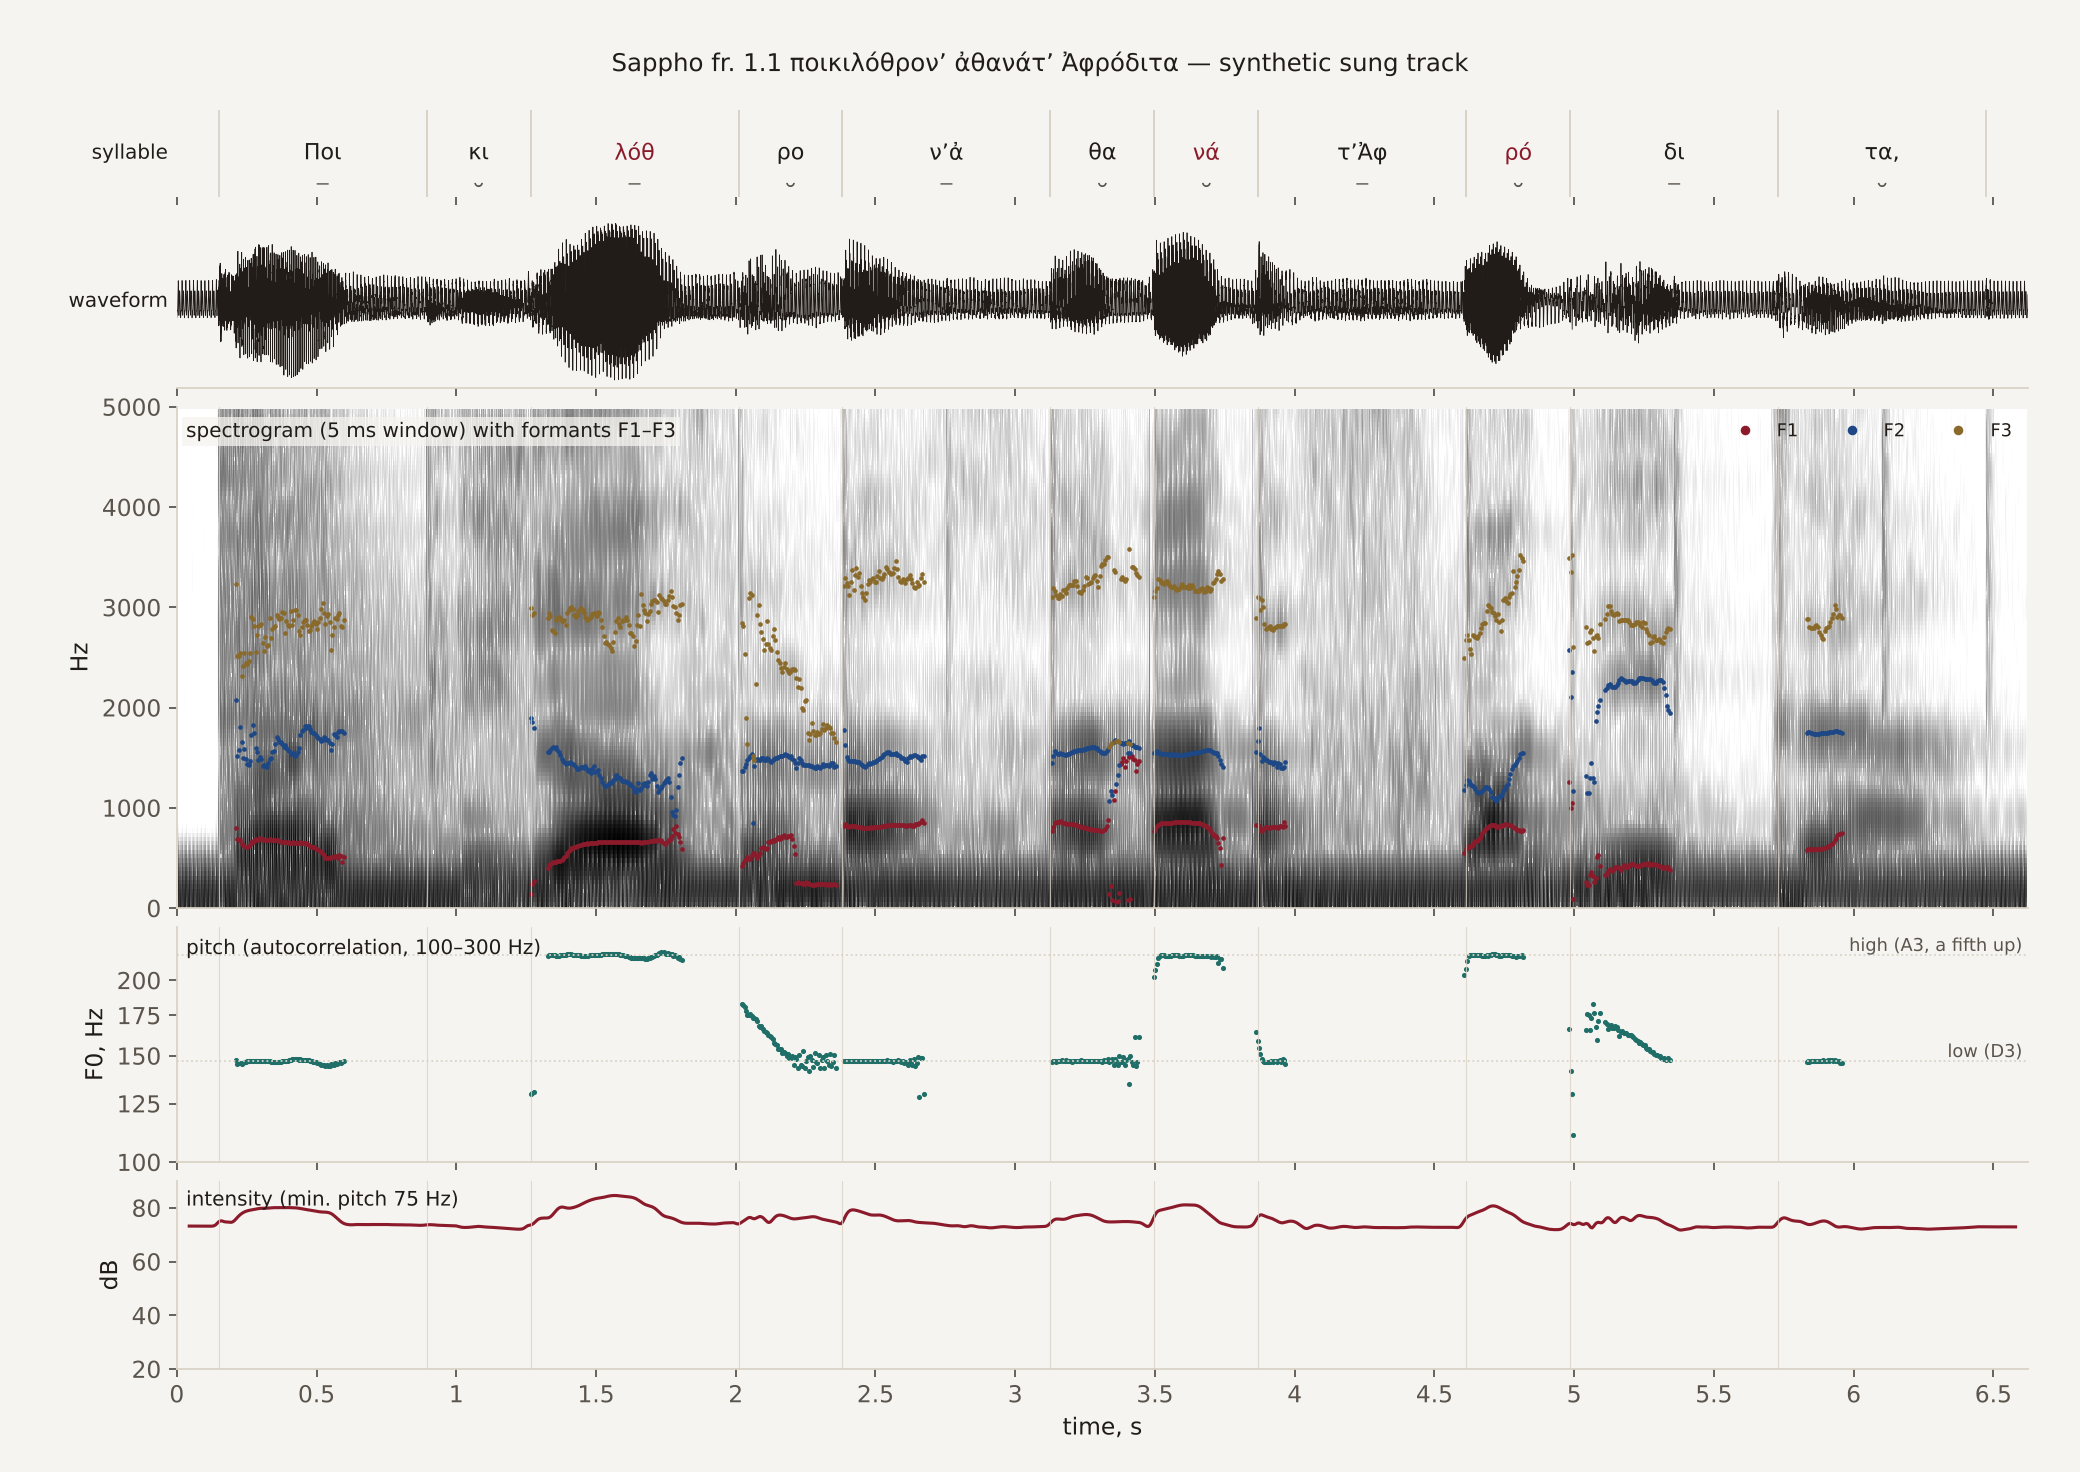
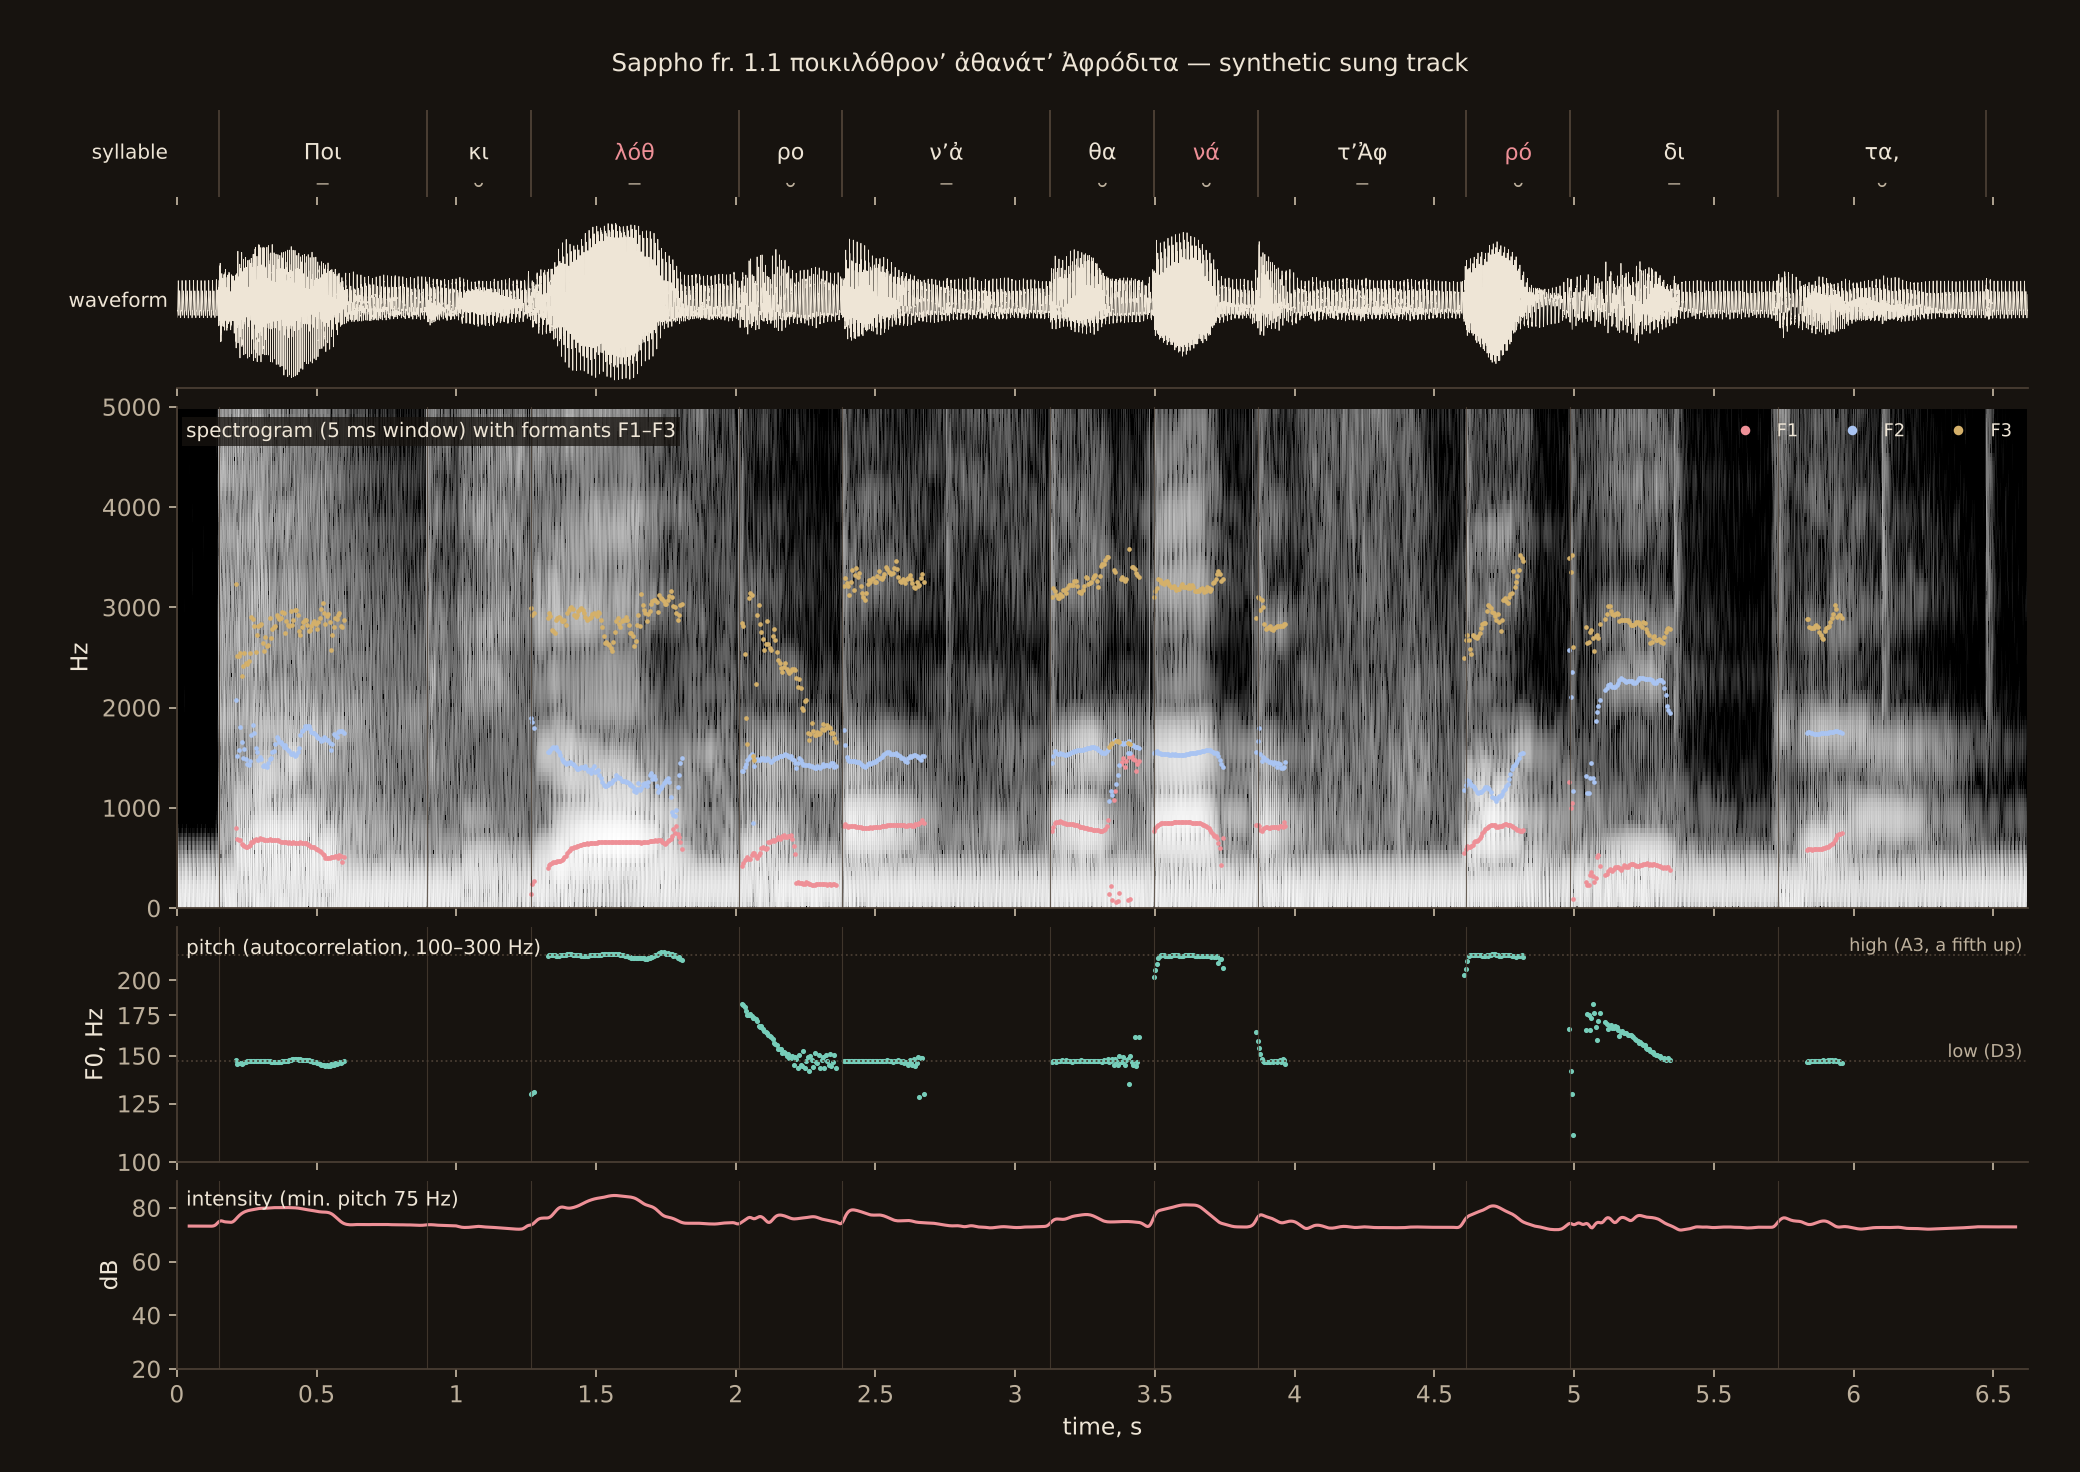
The synthetic voice does exactly what it was told. Every acute is a level high note a fifth above the low one. The syllable after it glides down, and everything else stays low. Set beside the real reader, this is a model of the written accents, not evidence for how they sounded, and it sings where Chamberlain speaks.
The fuzzy background of the spectrogram is the lyre drone and the echo of the room, which were added to the mix. For the same reason Praat’s pitch tracker loses the voice in several syllables. That is why its voicing threshold was lowered for these tracks.
Narrow band and broad band
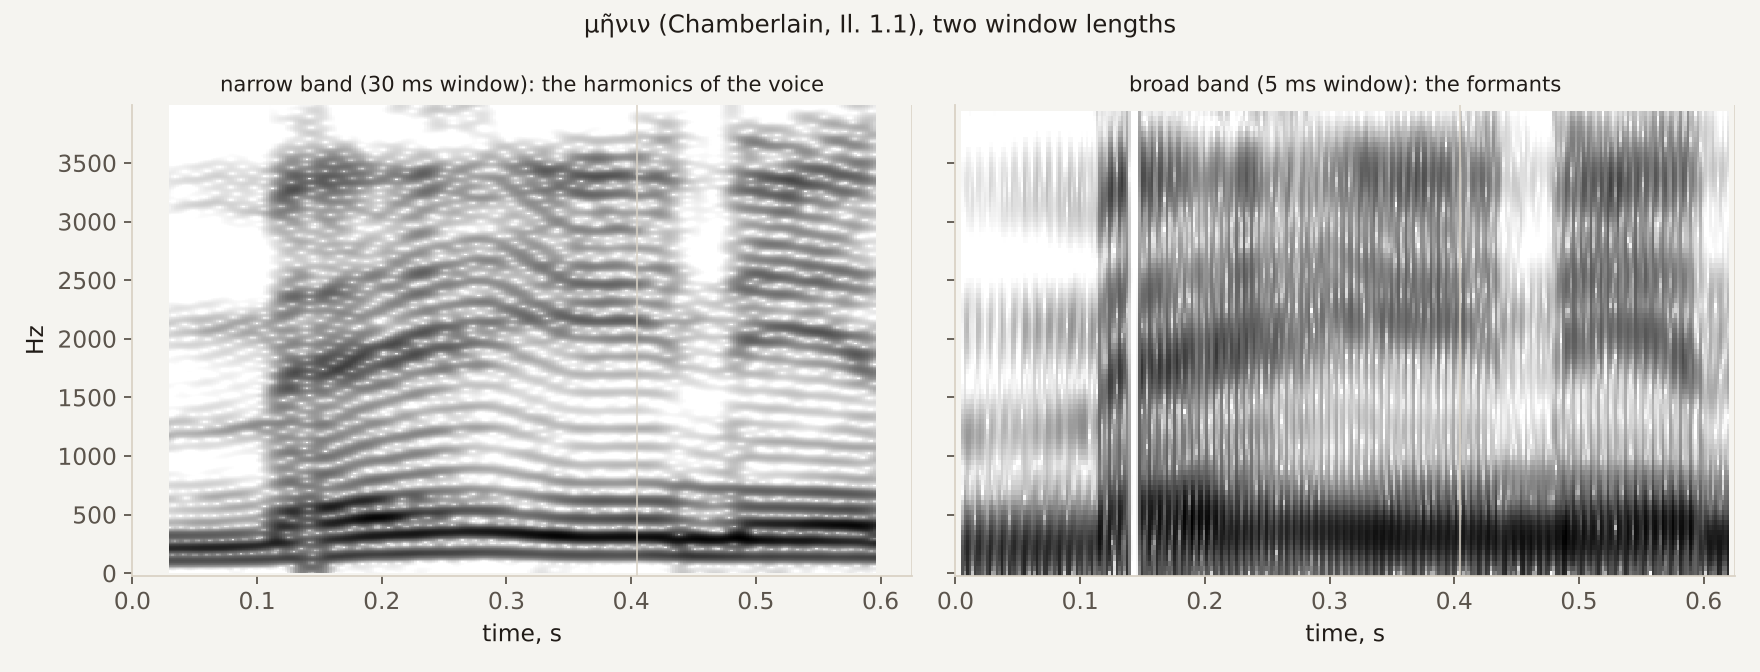
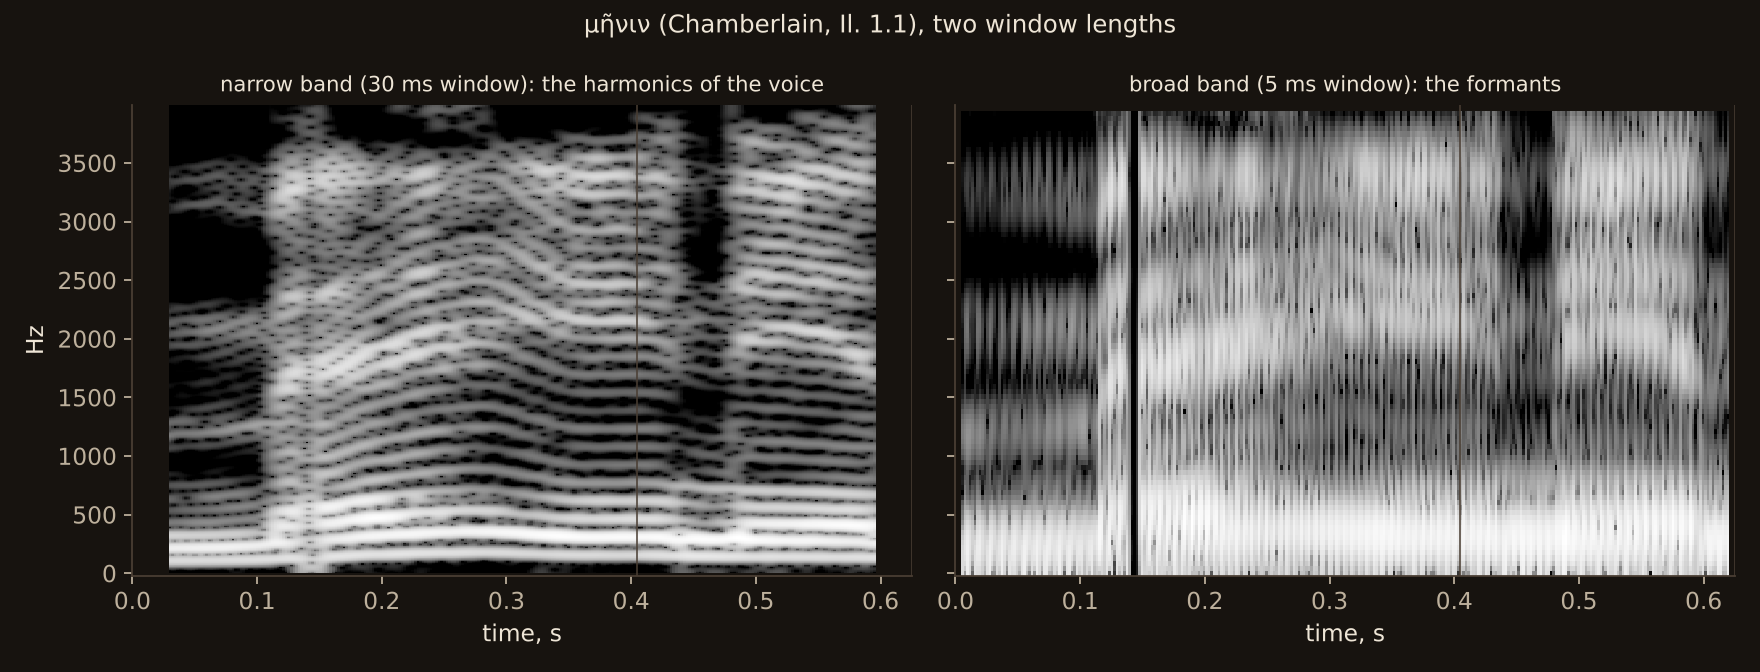
The choice of window decides what a spectrogram shows.[4] A long window of 30 ms gives a narrow-band spectrogram. In it the thin horizontal lines are the harmonics of the voice, which are whole multiples of F0. When the voice rises on μῆ-, every line rises, and the gaps between them widen.
A short window of 5 ms gives the broad-band picture on the right. It smears the harmonics into the broad bands of the formants. The formants hardly move within a vowel, but they jump at the consonants.
The slow demonstrations
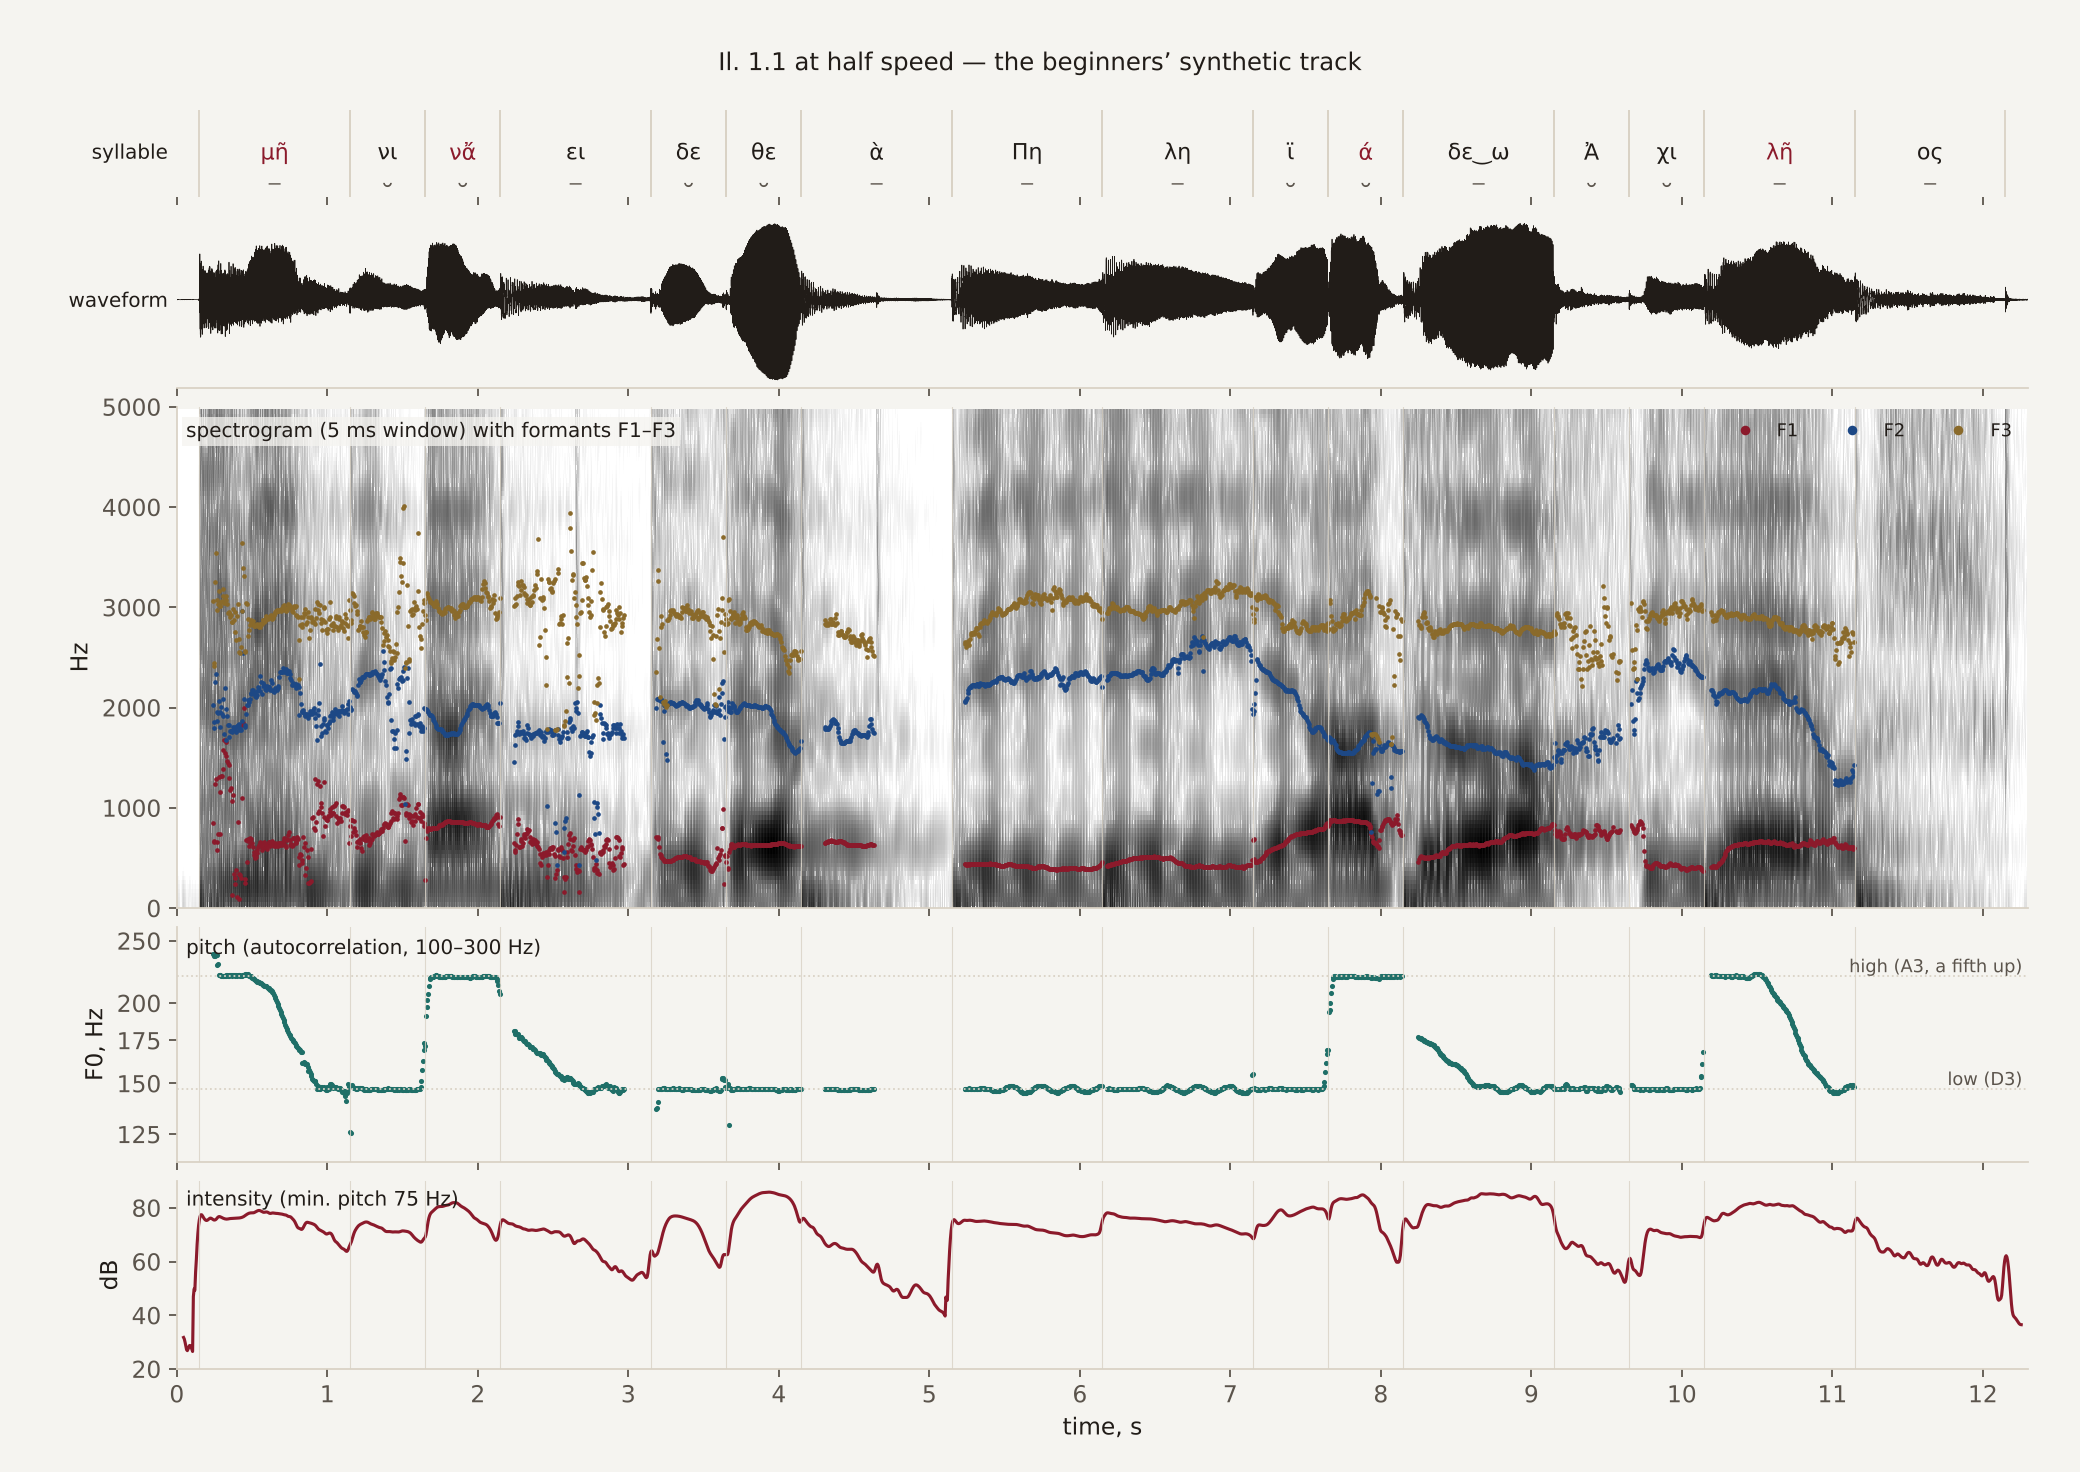
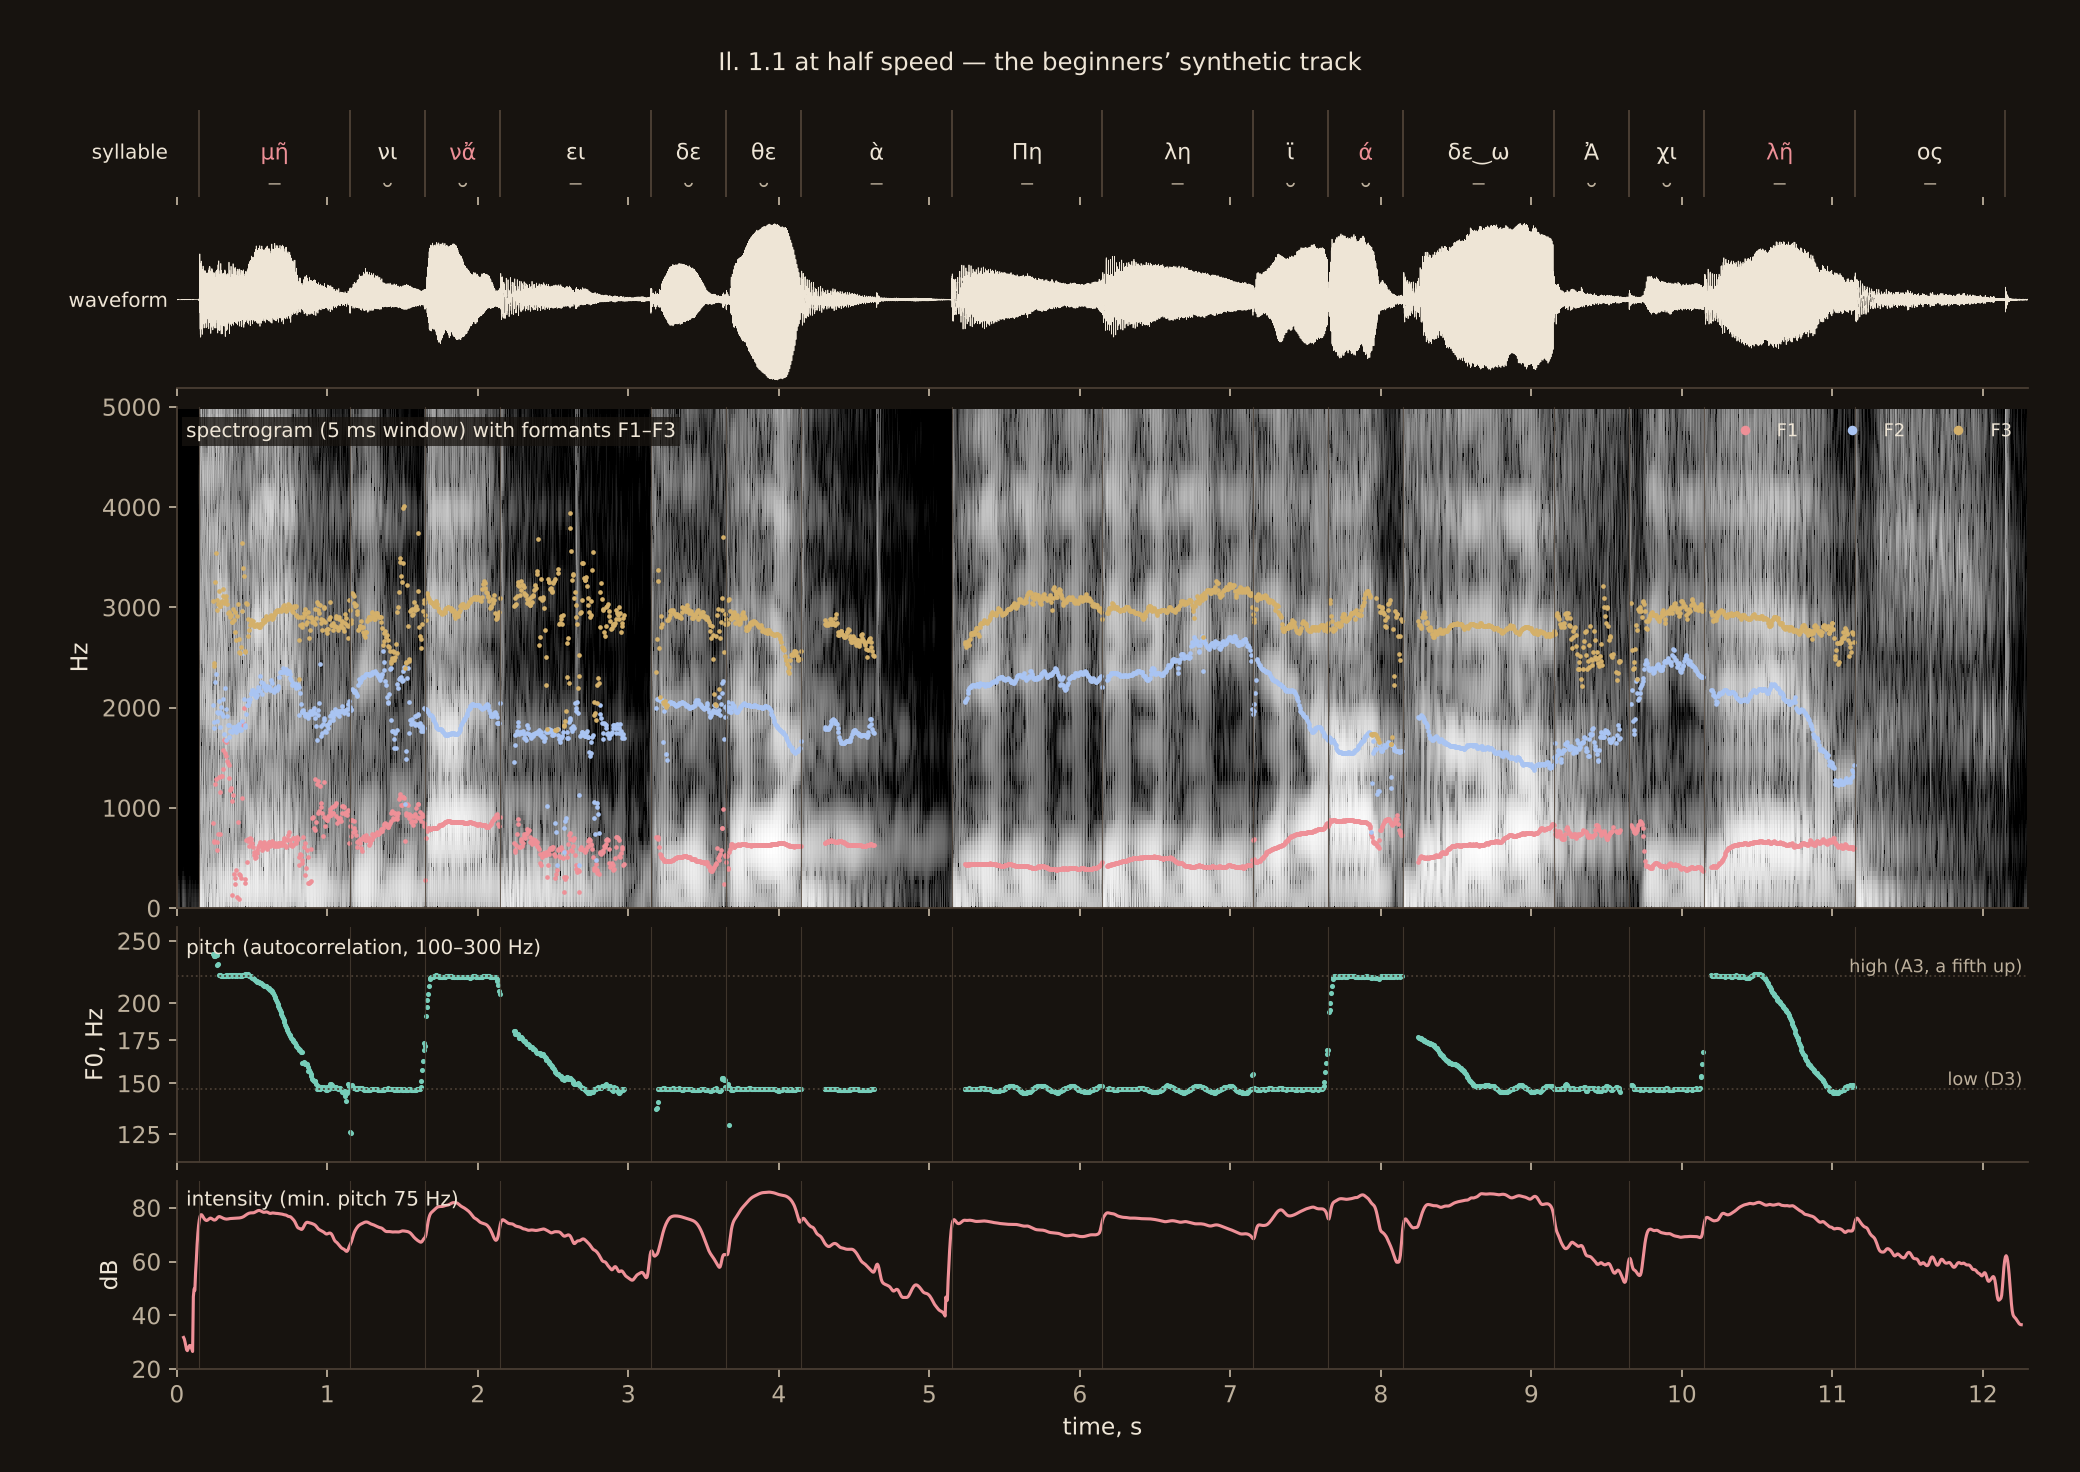
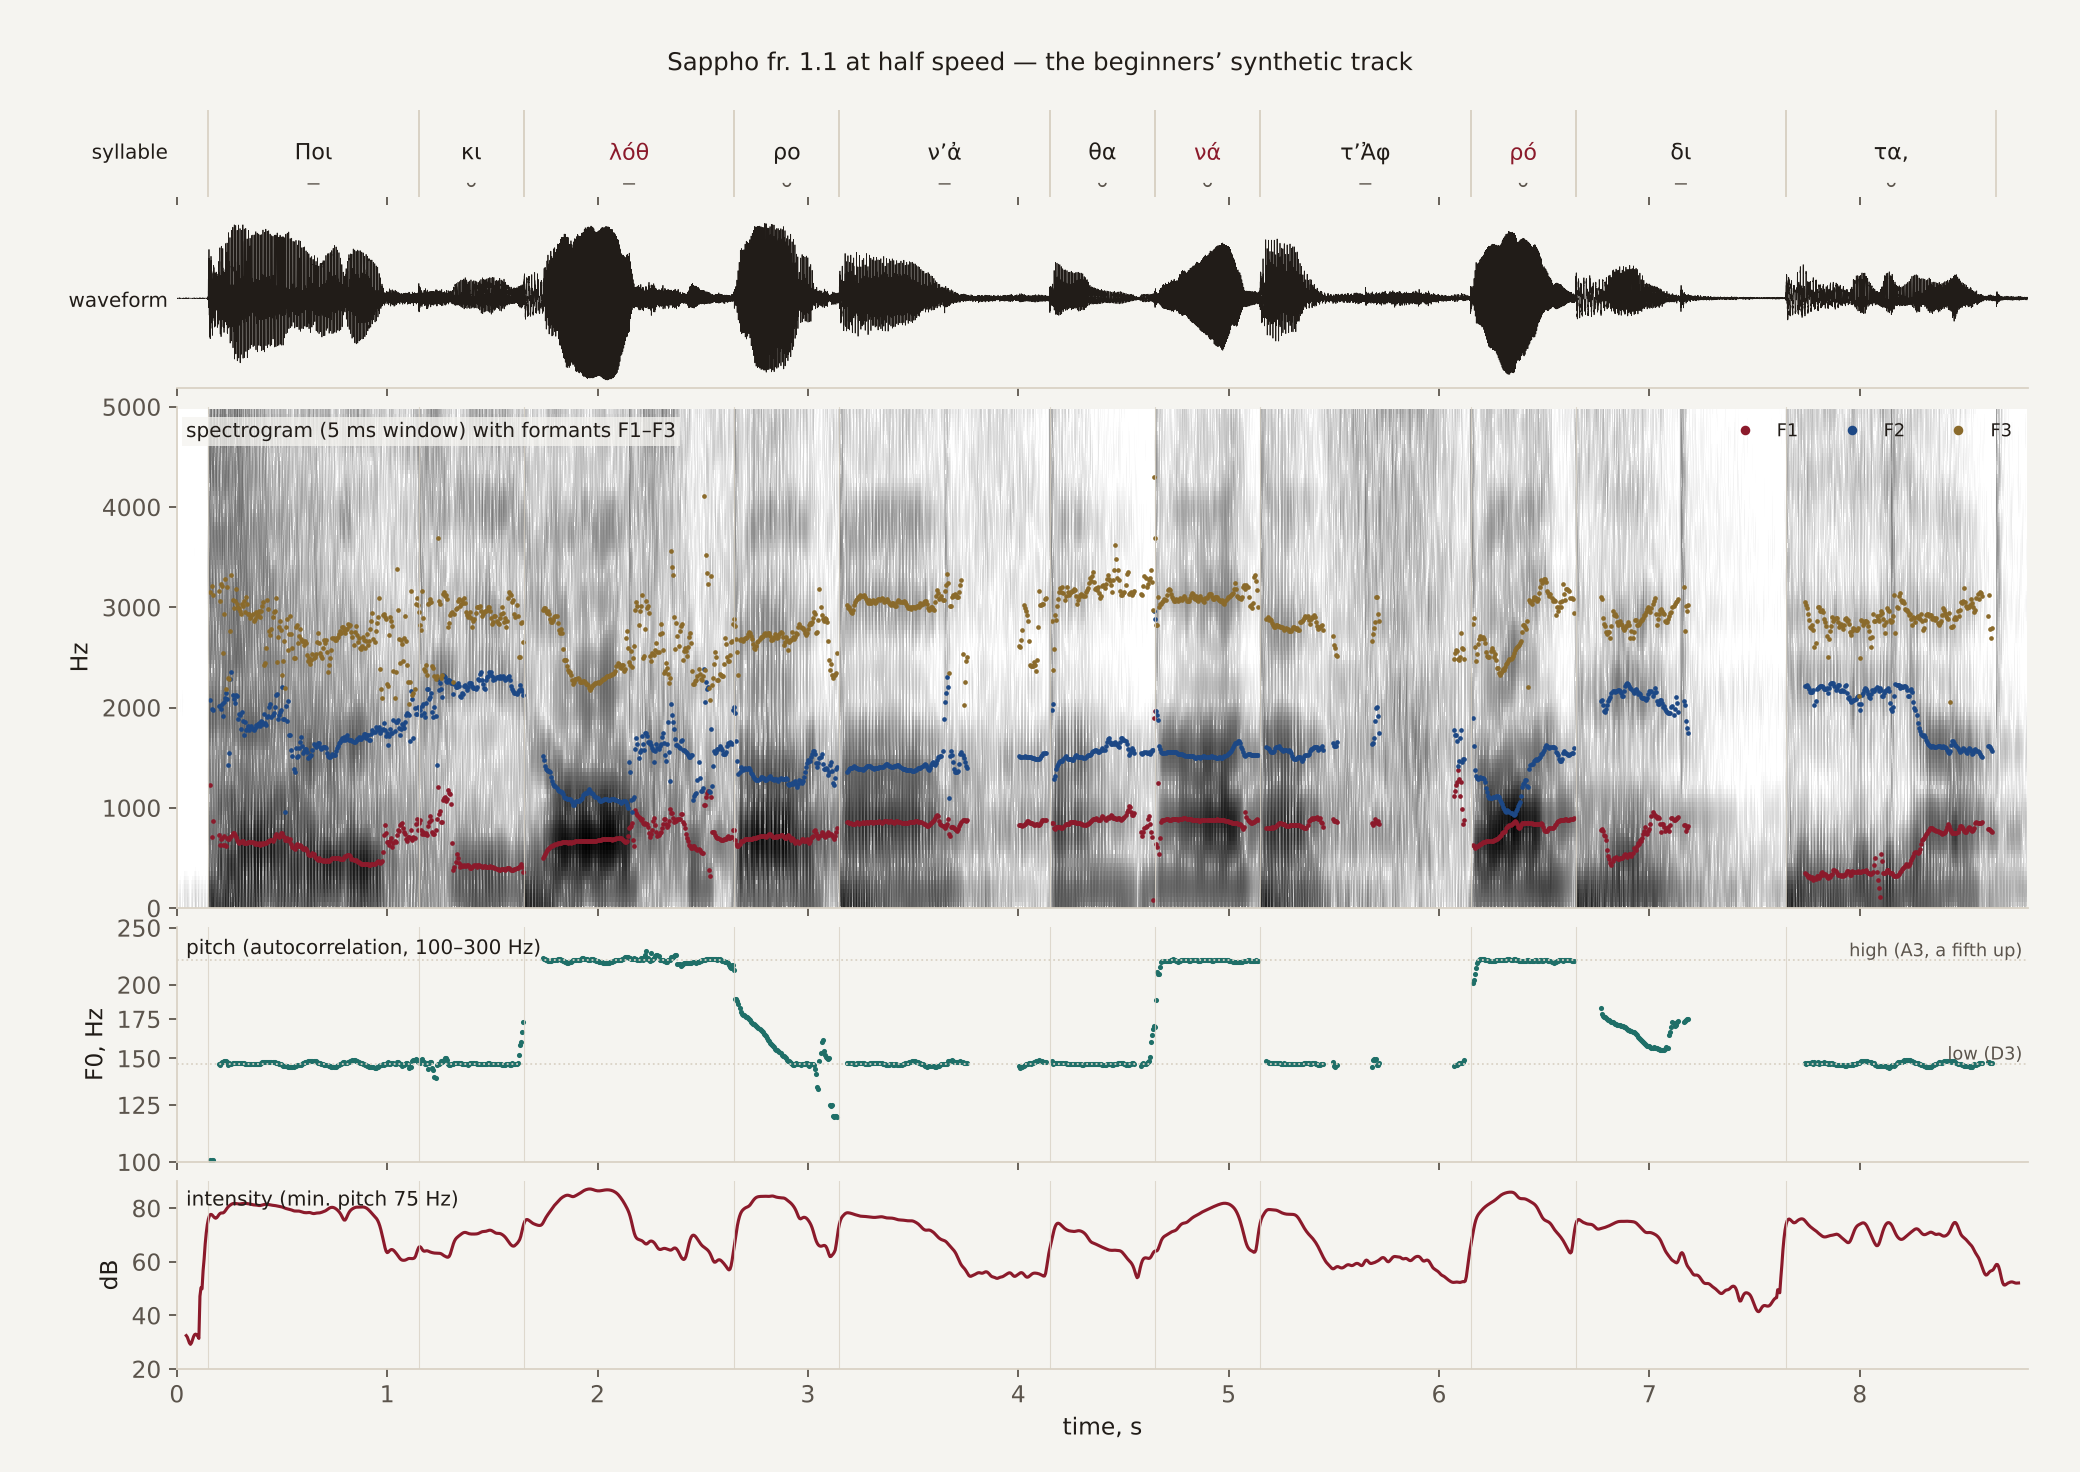
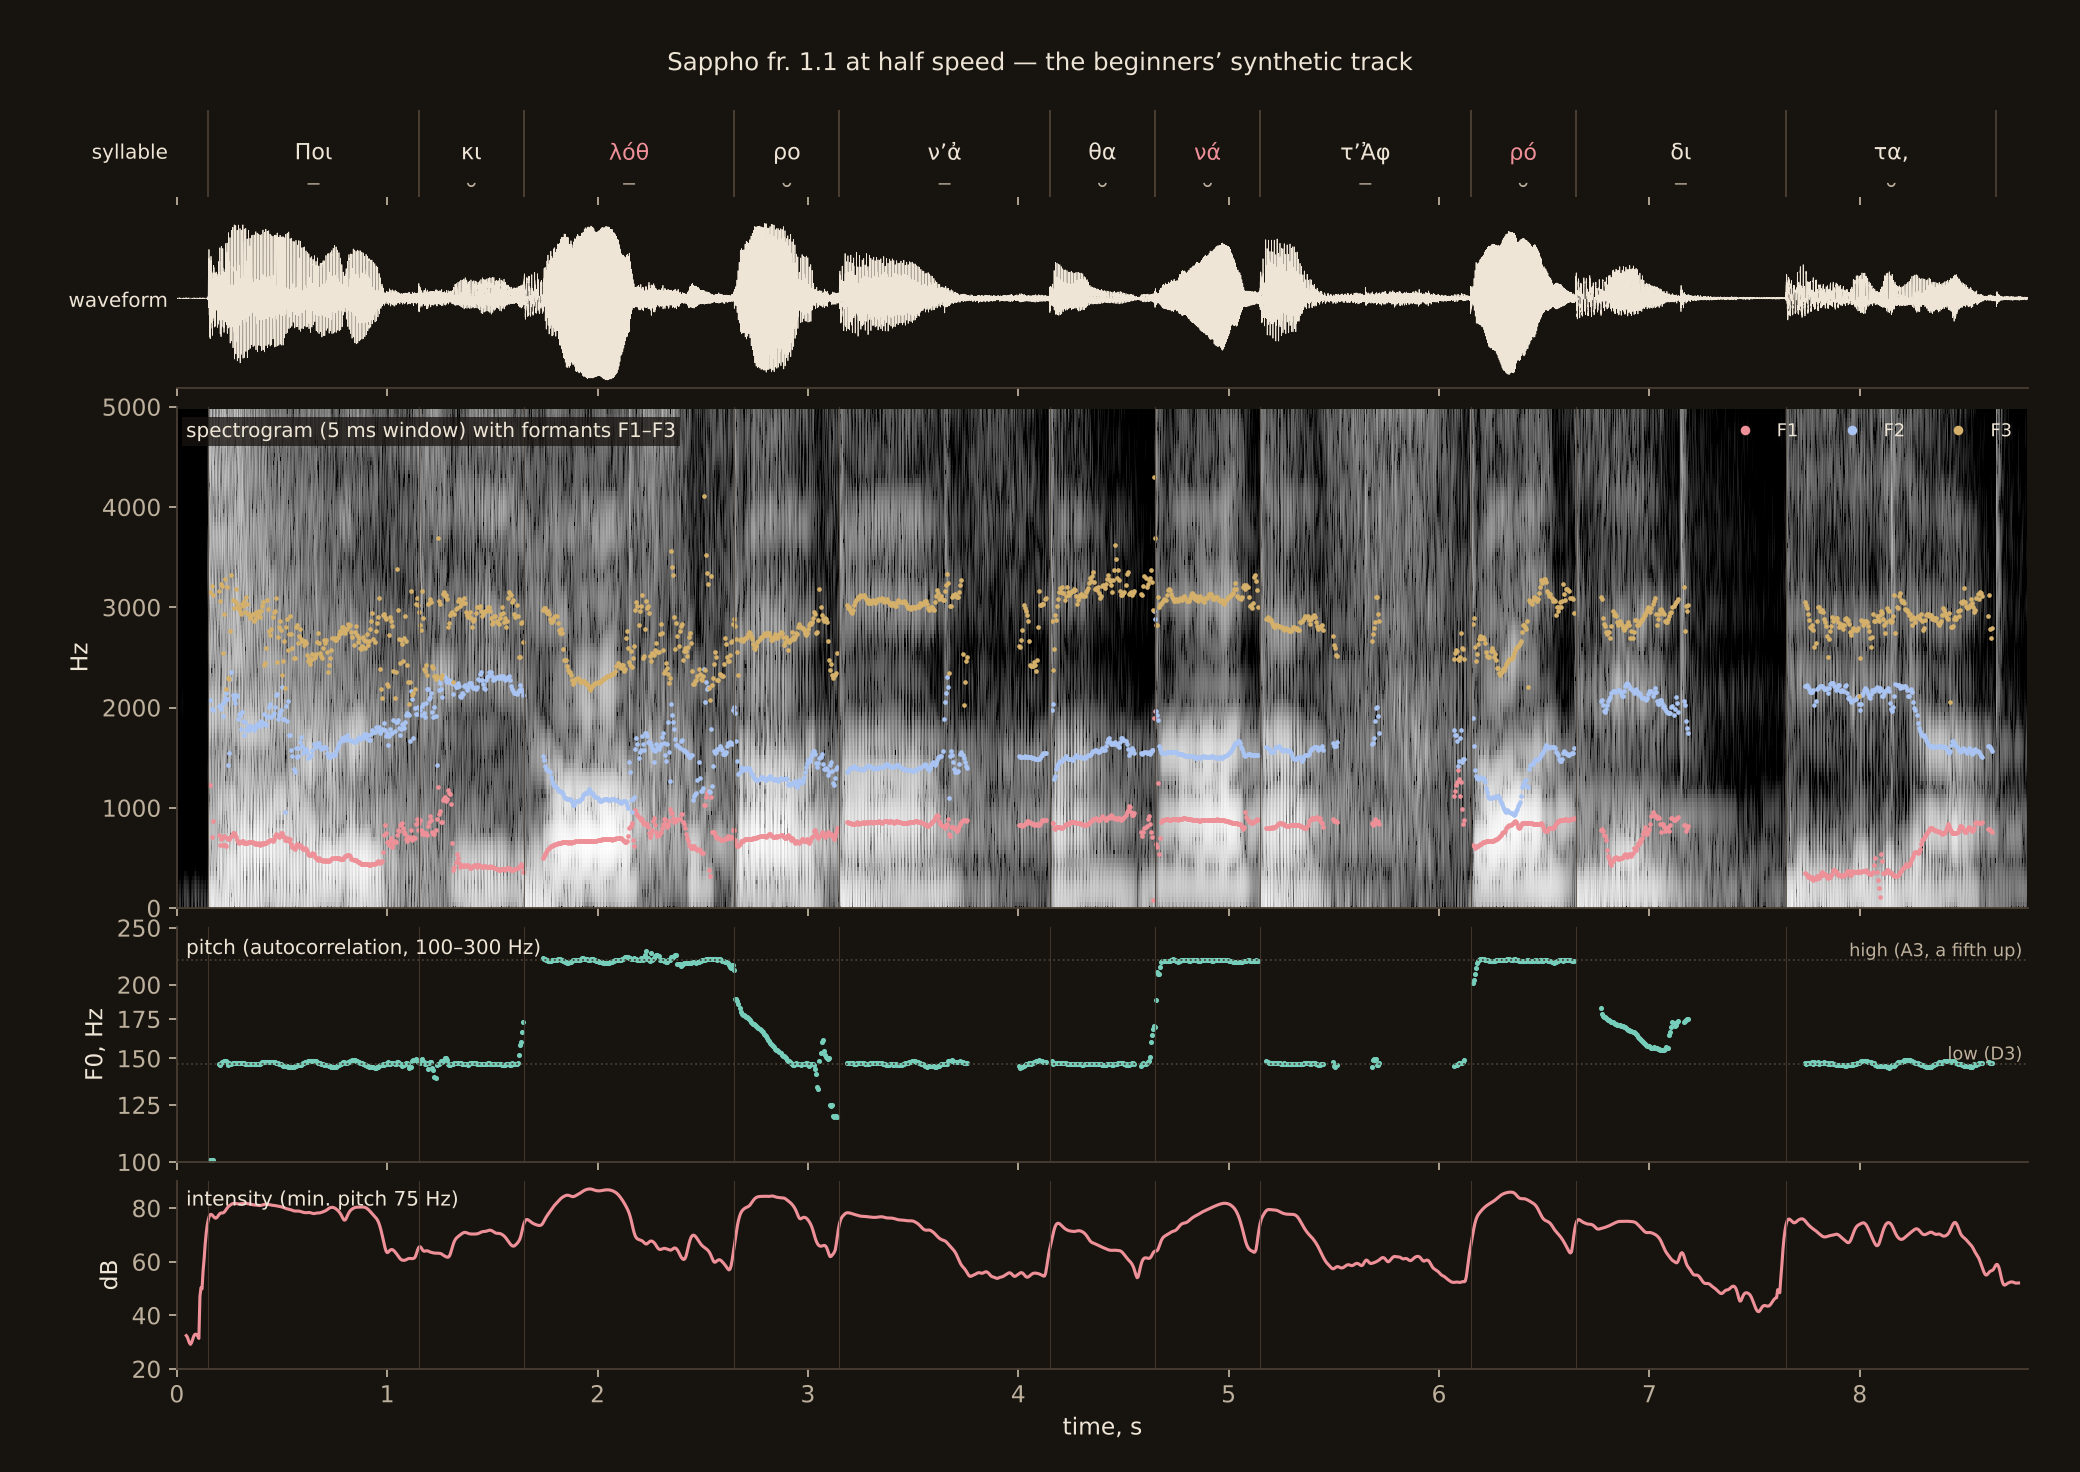
These two are the cleanest pictures on the page, because they have no drone. Each long syllable lasts exactly twice as long as a short one, and the pitch sits on only two notes. They show what the signs mean, not how a Greek spoke.
Notes
6. Sound lab · 2 of 7
The Iliad, line by line
David Chamberlain has recorded the whole of the Iliad in a restored ancient pronunciation. His reading keeps a steady hexameter beat and lays a light pitch accent over it. The first tab showed one line of it. This tab follows him through the first two hundred lines of Book 1, which tell of the quarrel between Agamemnon and Achilles.
The lines come in three passages, cut from the first two tracks of his recording of Book 1. Lines 1–52 are the proem and the priest Chryses. Lines 53–100 are the plague and the assembly, where the seer Calchas names its cause. Lines 101–200 are the quarrel itself, up to the moment when Athena comes down to hold Achilles back.
Every line, playable
Measured Choose a passage and a line, then press play. The picture shows three things for that line. Along the top are the syllables of the scansion, with their long or short signs; the accented syllables are red. In the middle is the pitch of the voice, in semitones above or below the reader’s middle. A semitone is the smallest step of a Western scale, and twelve of them make an octave. At the bottom is the loudness, in decibels.
A line crosses the picture as the sound plays, and the syllable under it lights up in the Greek. Click or tap the picture to play from that point. Tick Carry on to hear a whole passage, line after line. With a keyboard, move to the picture and use Space to play or pause, the arrow keys to move by a quarter of a second, and Page Up or Page Down to change the line.
The line explorer needs JavaScript. The recordings can also be heard on their own: lines 53–100, lines 101–200.
The syllable times were found by measurement, not marked by hand. They are good enough to follow the reading, but a syllable’s edge can be a tenth of a second out. The pauses are the reader’s breaths. Most of them fall at the caesura, the word-break in the middle of the line.
Two lines in full
The full pictures add the waveform and the spectrogram, which the first tab explains. Both lines are speech introductions, the kind of formula line that recurs throughout Homer.
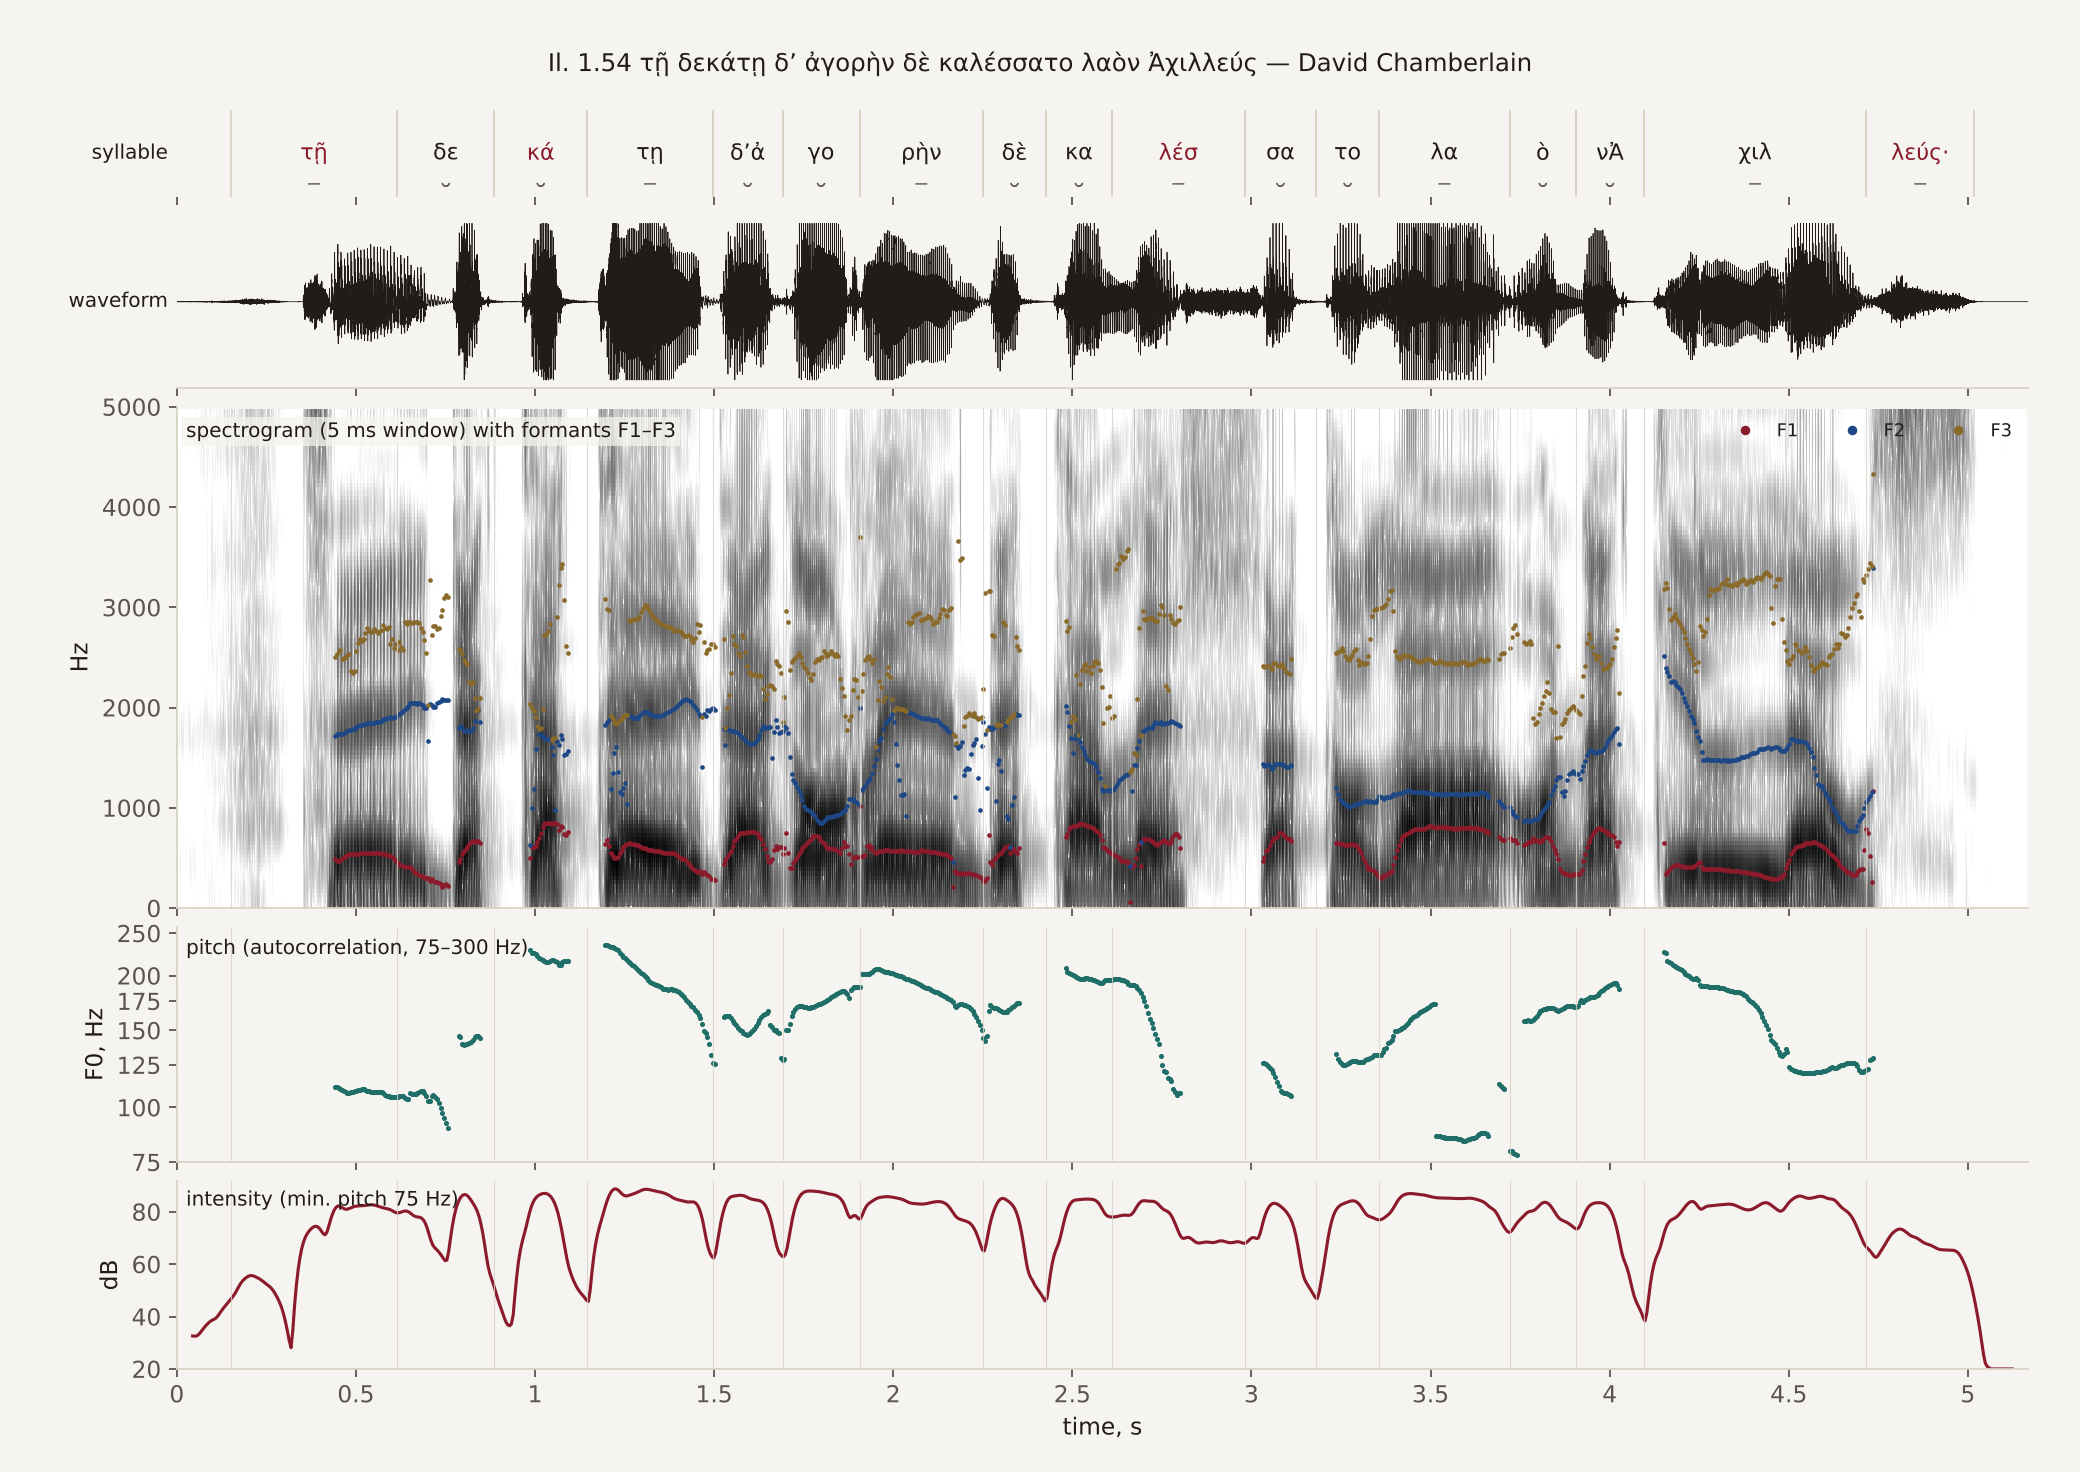
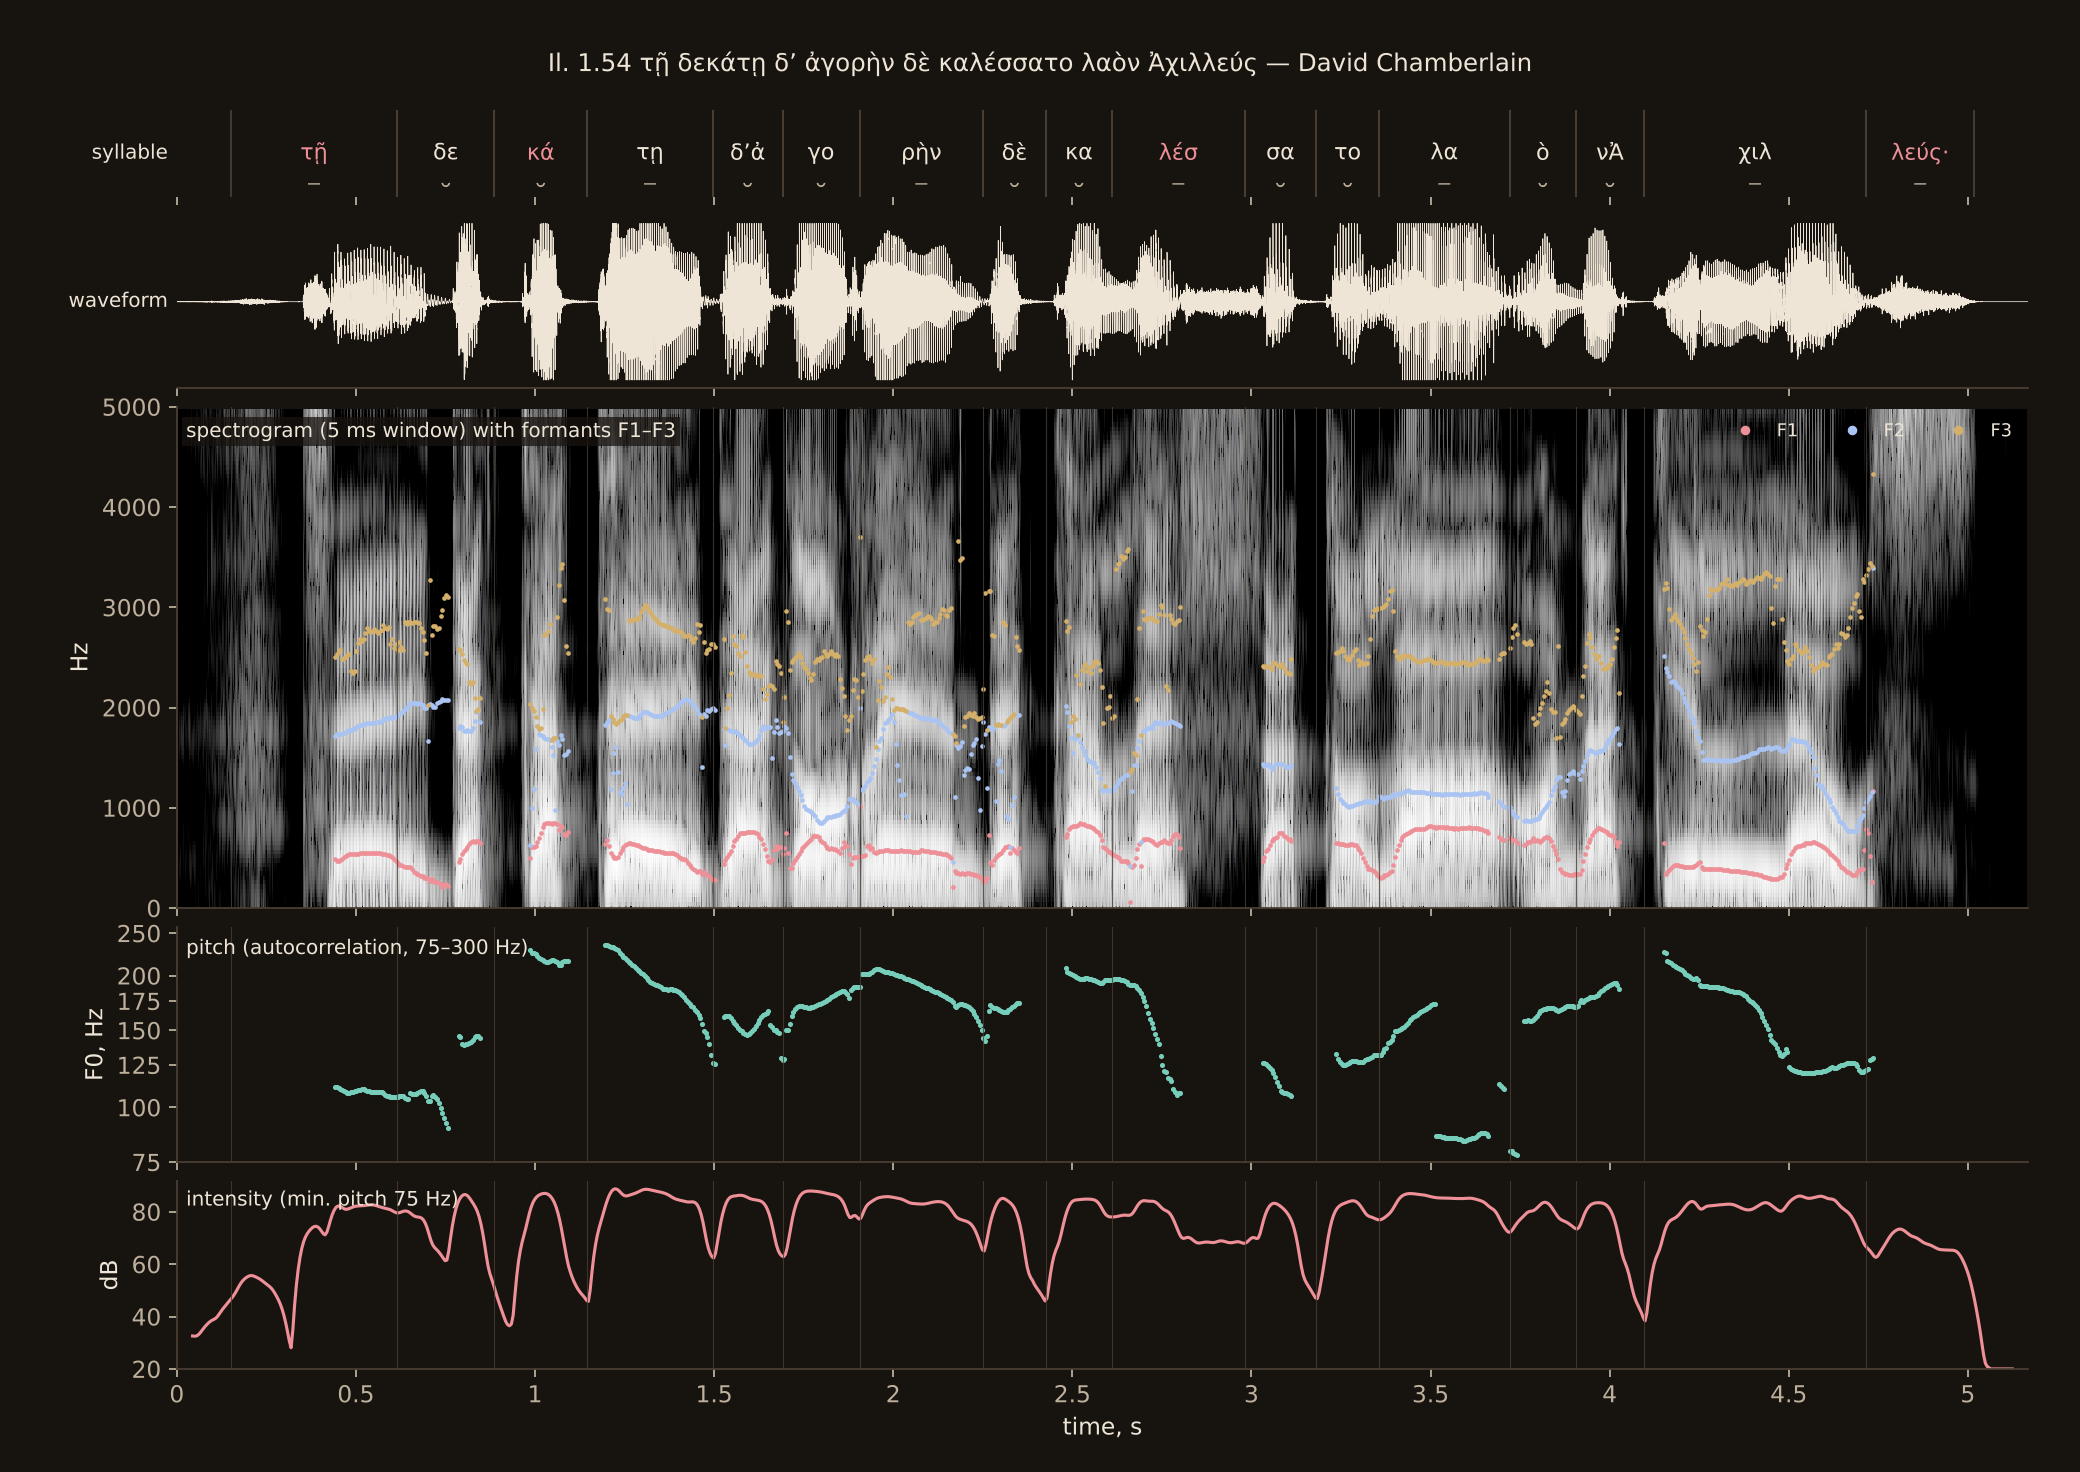
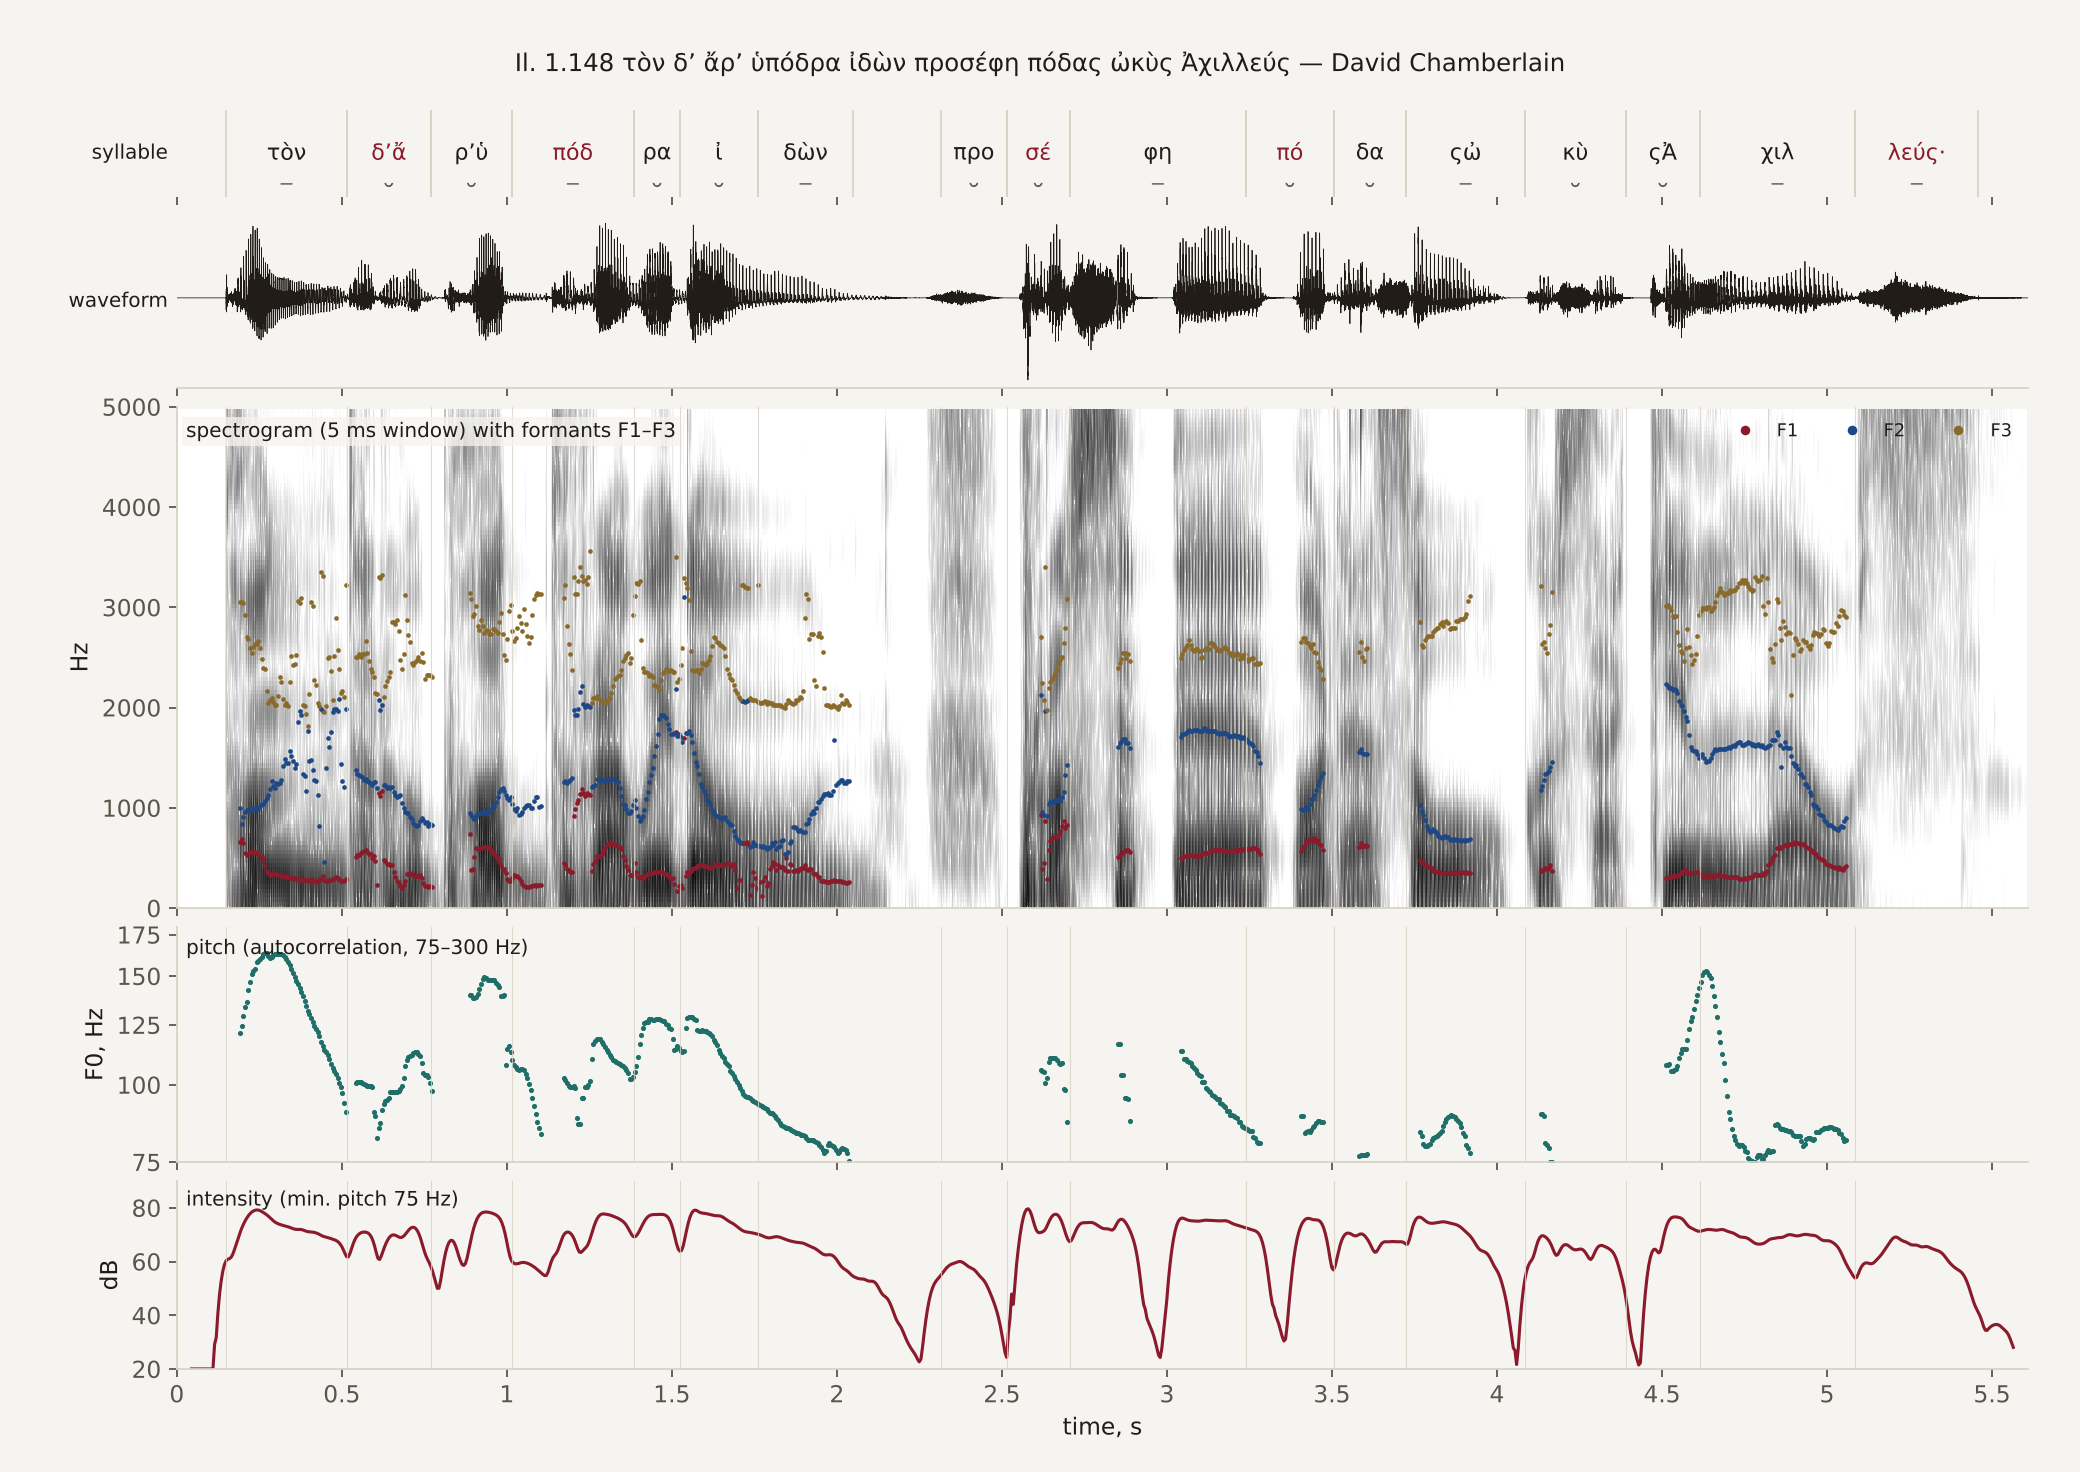
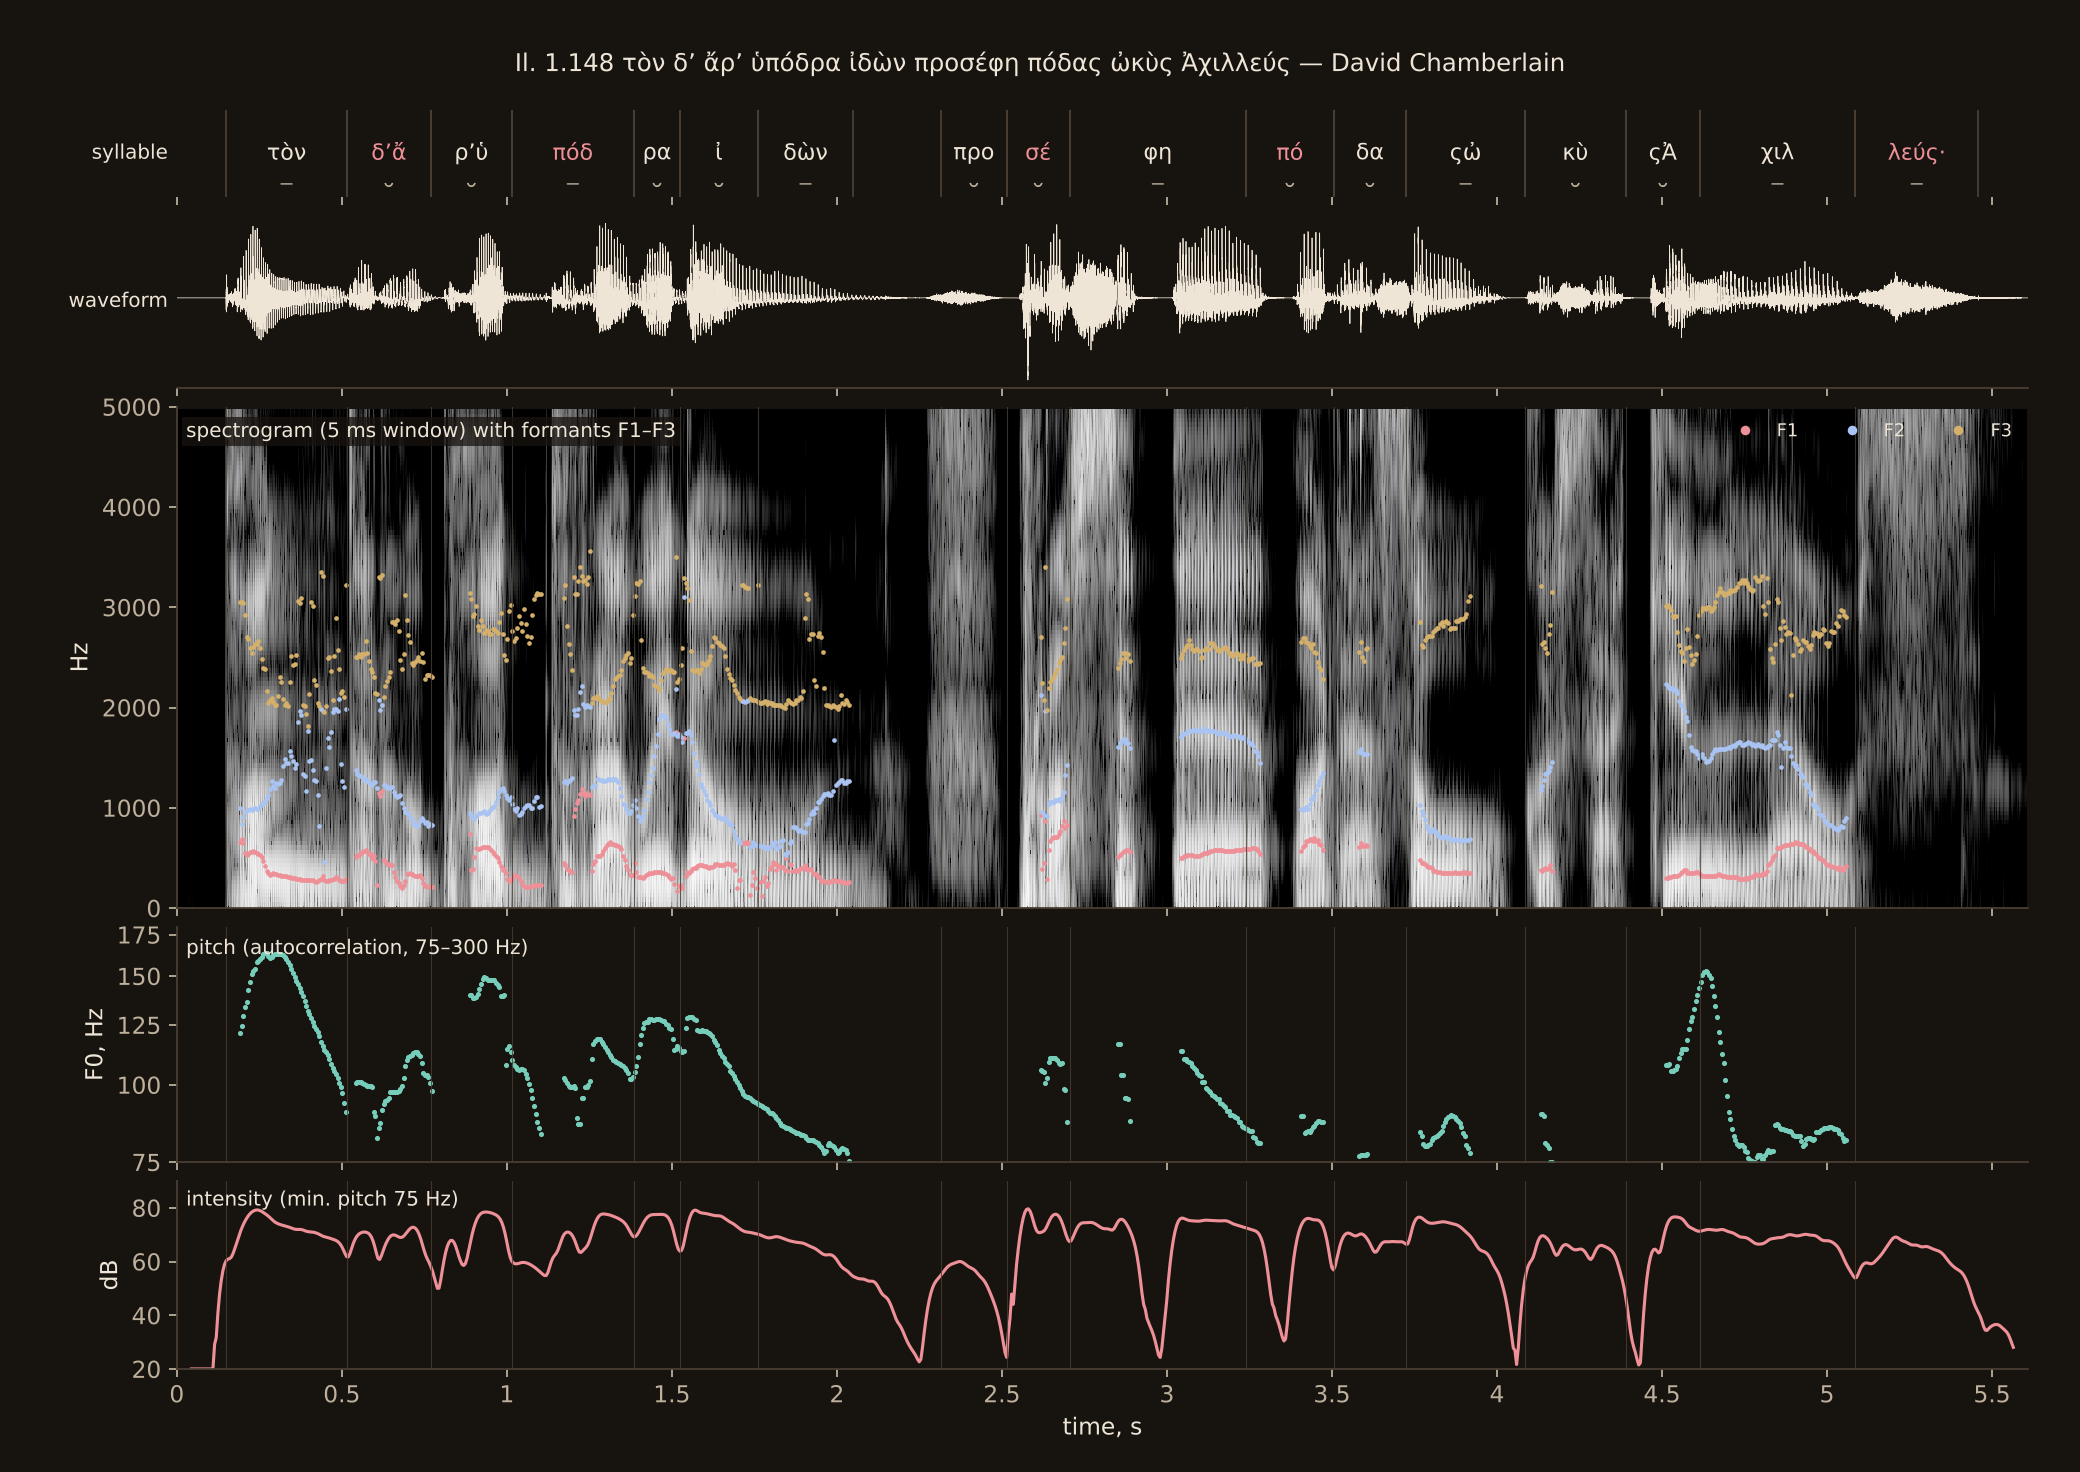
In line 148 the reader takes a breath after ἰδὼν, at the caesura. His voice also drops to the bottom of its range, near 80 Hz, at the ends of the phrases. The first syllable, τὸν, carries a grave, yet he starts the line high on it. A reader’s sentence melody often outweighs the written accent in this way.
The same measurements over 200 lines
Measured The Pitch accent and Quantity tabs measure lines 1–52. The tables below repeat their tests on each passage, and on all 200 lines together. Pitch is measured in semitones from each passage’s own middle, so that a passage read in a lower voice is not counted as low throughout.
| Passage | Measured syllables |
Voice middle (Hz) |
Range (st) |
Acute / circumflex grave / unaccented (st) |
Accent highest in word |
Fall after accent (st) |
Unaccented fall (st) |
|---|---|---|---|---|---|---|---|
| Iliad 1.1–52 | 775 | 134 | 14.1 | +2.2 / +0.6 / +0.4 / −0.6 | 94 of 190 (49%) | 2.1 | 0.9 |
| Iliad 1.53–100 | 716 | 117 | 15.2 | +0.1 / +0.5 / +0.6 / 0.0 | 60 of 152 (39%) | 1.5 | 0.5 |
| Iliad 1.101–200 | 1488 | 131 | 16.2 | +0.8 / +0.4 / 0.0 / −0.4 | 157 of 332 (47%) | 2.2 | 0.8 |
| All 200 lines | 2979 | — | 15.4 | +1.0 / +0.6 / +0.3 / −0.3 | 311 of 674 (46%) | 2.0 | 0.8 |
The range is the spread of the syllables’ pitches from the 5th to the 95th centile. The four figures in the middle column are the median height of each kind of syllable. The test of the highest syllable comes from the Seikilos song, where the acute is nearly always set on a higher note than any other syllable of its word.[1]
Two results hold across the passages, and one does not.
- The fall after the accent holds. In every passage the voice drops more after an accented syllable than it does between two unaccented ones: by 2.0 semitones against 0.8 over the 200 lines. In the Delphic paeans the fall after the accent is about 2.6 semitones.[2] The fall is where this reader’s accent lives.
- The highest syllable holds, weakly. In fewer than half of the words is the accented syllable the highest. A reading voice glides across words and phrases, and that movement often outweighs the accent.
- The height of the acute does not hold. In lines 1–52 the acute stands 2.2 semitones above the middle of the voice. In lines 53–100 it stands no higher than an unaccented syllable. From line 69, where Calchas the seer comes forward, to the end of that passage, the reader’s voice sits lower, near 100 Hz, and the accent’s lift is smaller.
Measured The quantity tests ask whether a long syllable takes about twice the time of a short one. A long syllable counts as two shorts in the metre.[3]
| Passage | Lines | Line test long / short (ms) |
Ratio (95% interval) |
Extra syllable time (ms) |
Vowel peaks long / short (ms) |
Ratio |
|---|---|---|---|---|---|---|
| Iliad 1.1–52 | 52 | 428 / 186 | 2.3 (1.8–3.1) | −29 | 333 / 202 | 1.6 |
| Iliad 1.53–100 | 48 | 407 / 195 | 2.1 (1.8–2.6) | −11 | 340 / 200 | 1.7 |
| Iliad 1.101–200 | 100 | 394 / 196 | 2.0 (1.7–2.4) | −3 | 330 / 205 | 1.6 |
| All 200 lines | 200 | 409 / 190 | 2.2 (1.9–2.4) | −21 | 330 / 205 | 1.6 |
The line test needs no syllable boundaries at all. A line with more dactyls has more syllables, but if a long takes twice a short, every line should take the same time. Over 200 lines that is what happens: an extra syllable adds nothing to the time of the line. The ratio of a long to a short comes out at 2.2, with 1.9 to 2.4 as its likely range.
The second test measures from one vowel peak to the next, in the stretches where Praat finds exactly as many peaks as there are syllables.[4] It gives a smaller ratio, 1.6. The Quantity tab discusses why the two tests differ. Part of the reason is that the consonants which make a syllable long by position fall between the vowel peaks.
Notes
6. Sound lab · 3 of 7
Other readers
How a reader sounds depends on the pronunciation he or she chooses. This tab sets several freely licensed readings of the same lines side by side. Four readers give the opening of the Iliad, and two give the opening of the Odyssey. Each picture plays like those on the first tab.
Two terms are needed here. A pitch accent marks a syllable by raising the voice. A stress accent marks it by saying it more loudly and often for longer, as English does. An ictus is a beat placed on the first long syllable of every foot, the position called the princeps, so that the metre can be heard as a pulse. Some readers use the ictus in place of the written accent, and some use both.
One line, read four ways
DerHexer, a contributor to Wikimedia Commons, recorded the first seven lines of the Iliad three times in 2008, each time in a different style. The first two readings put an ictus on every princeps. The third tries a musical accent instead, which means a pitch accent, in a steady rhythm.
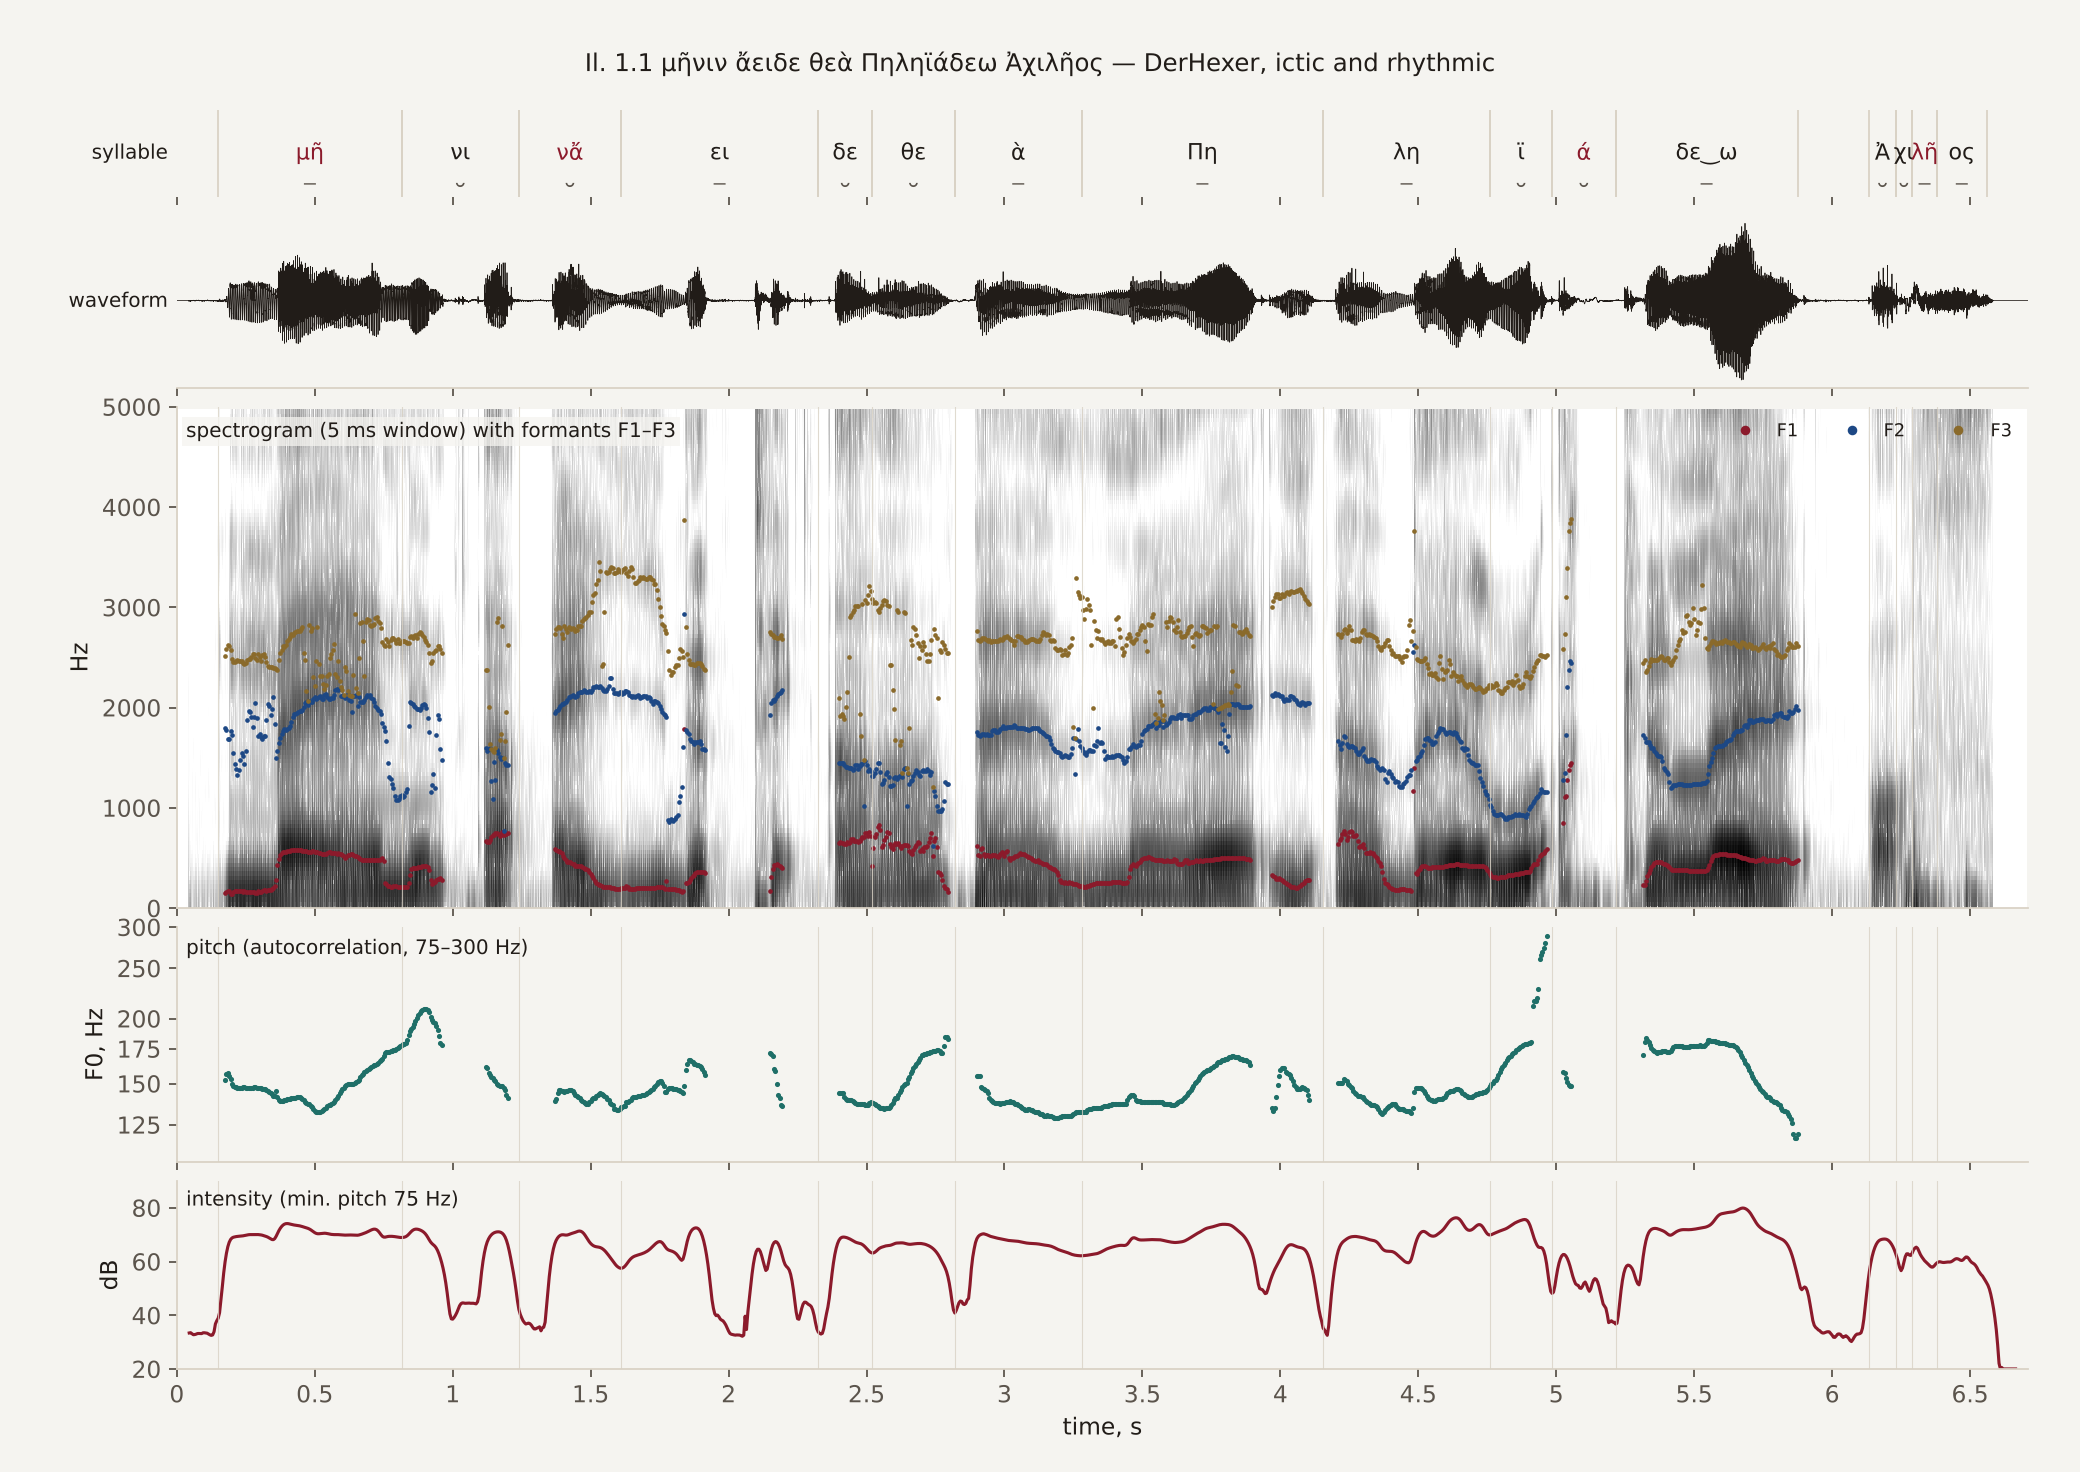
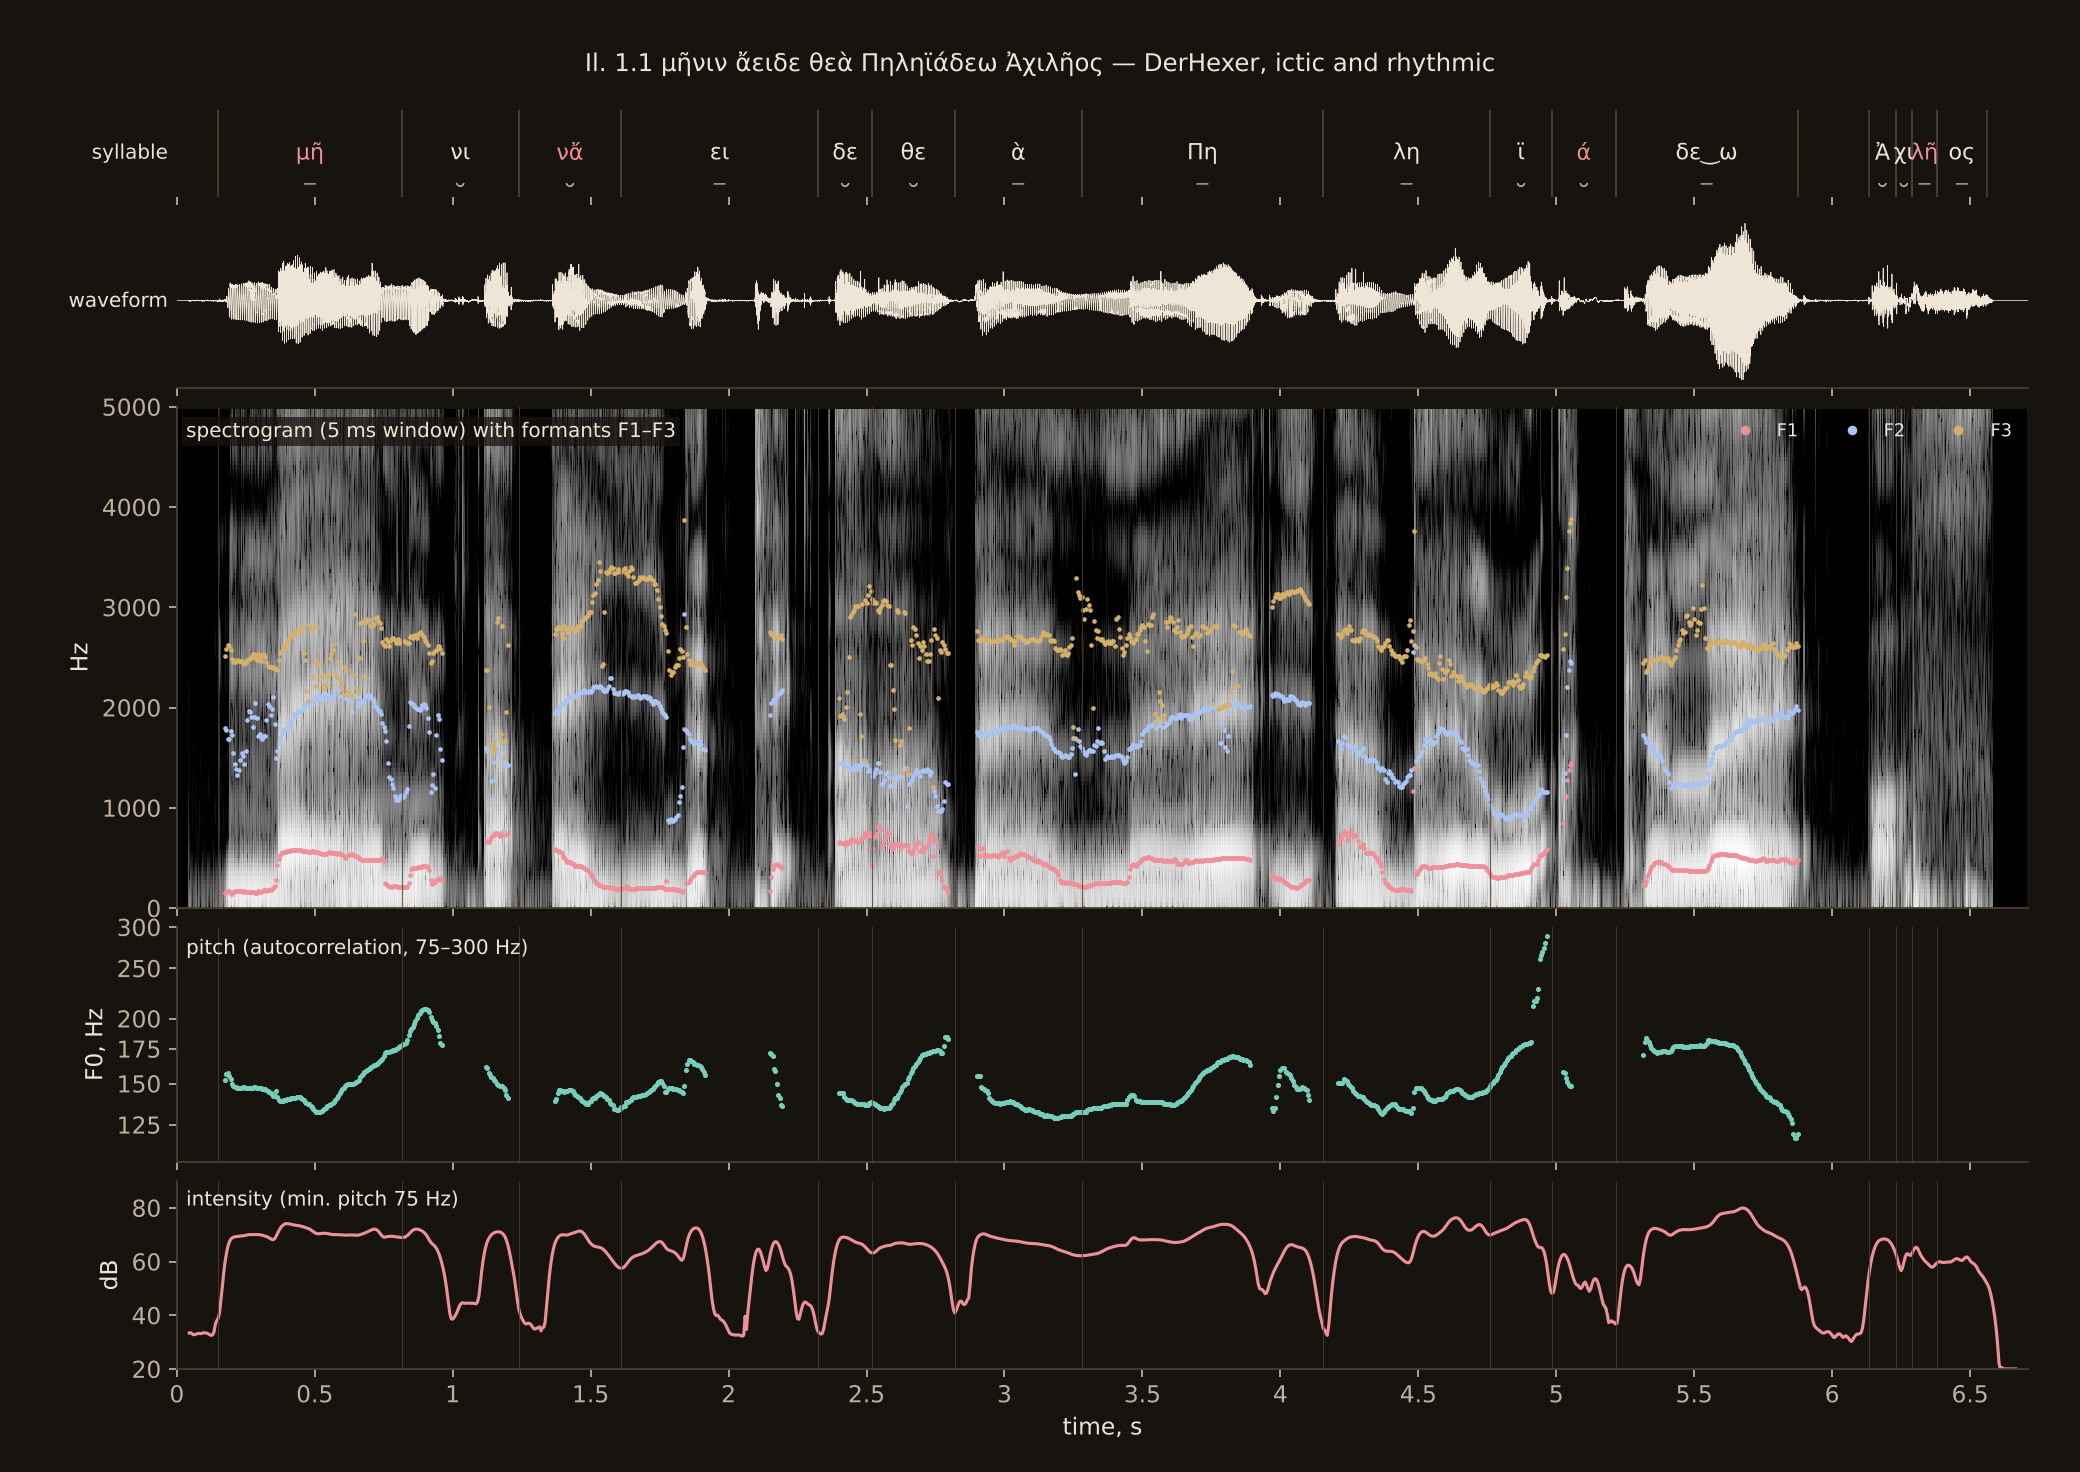
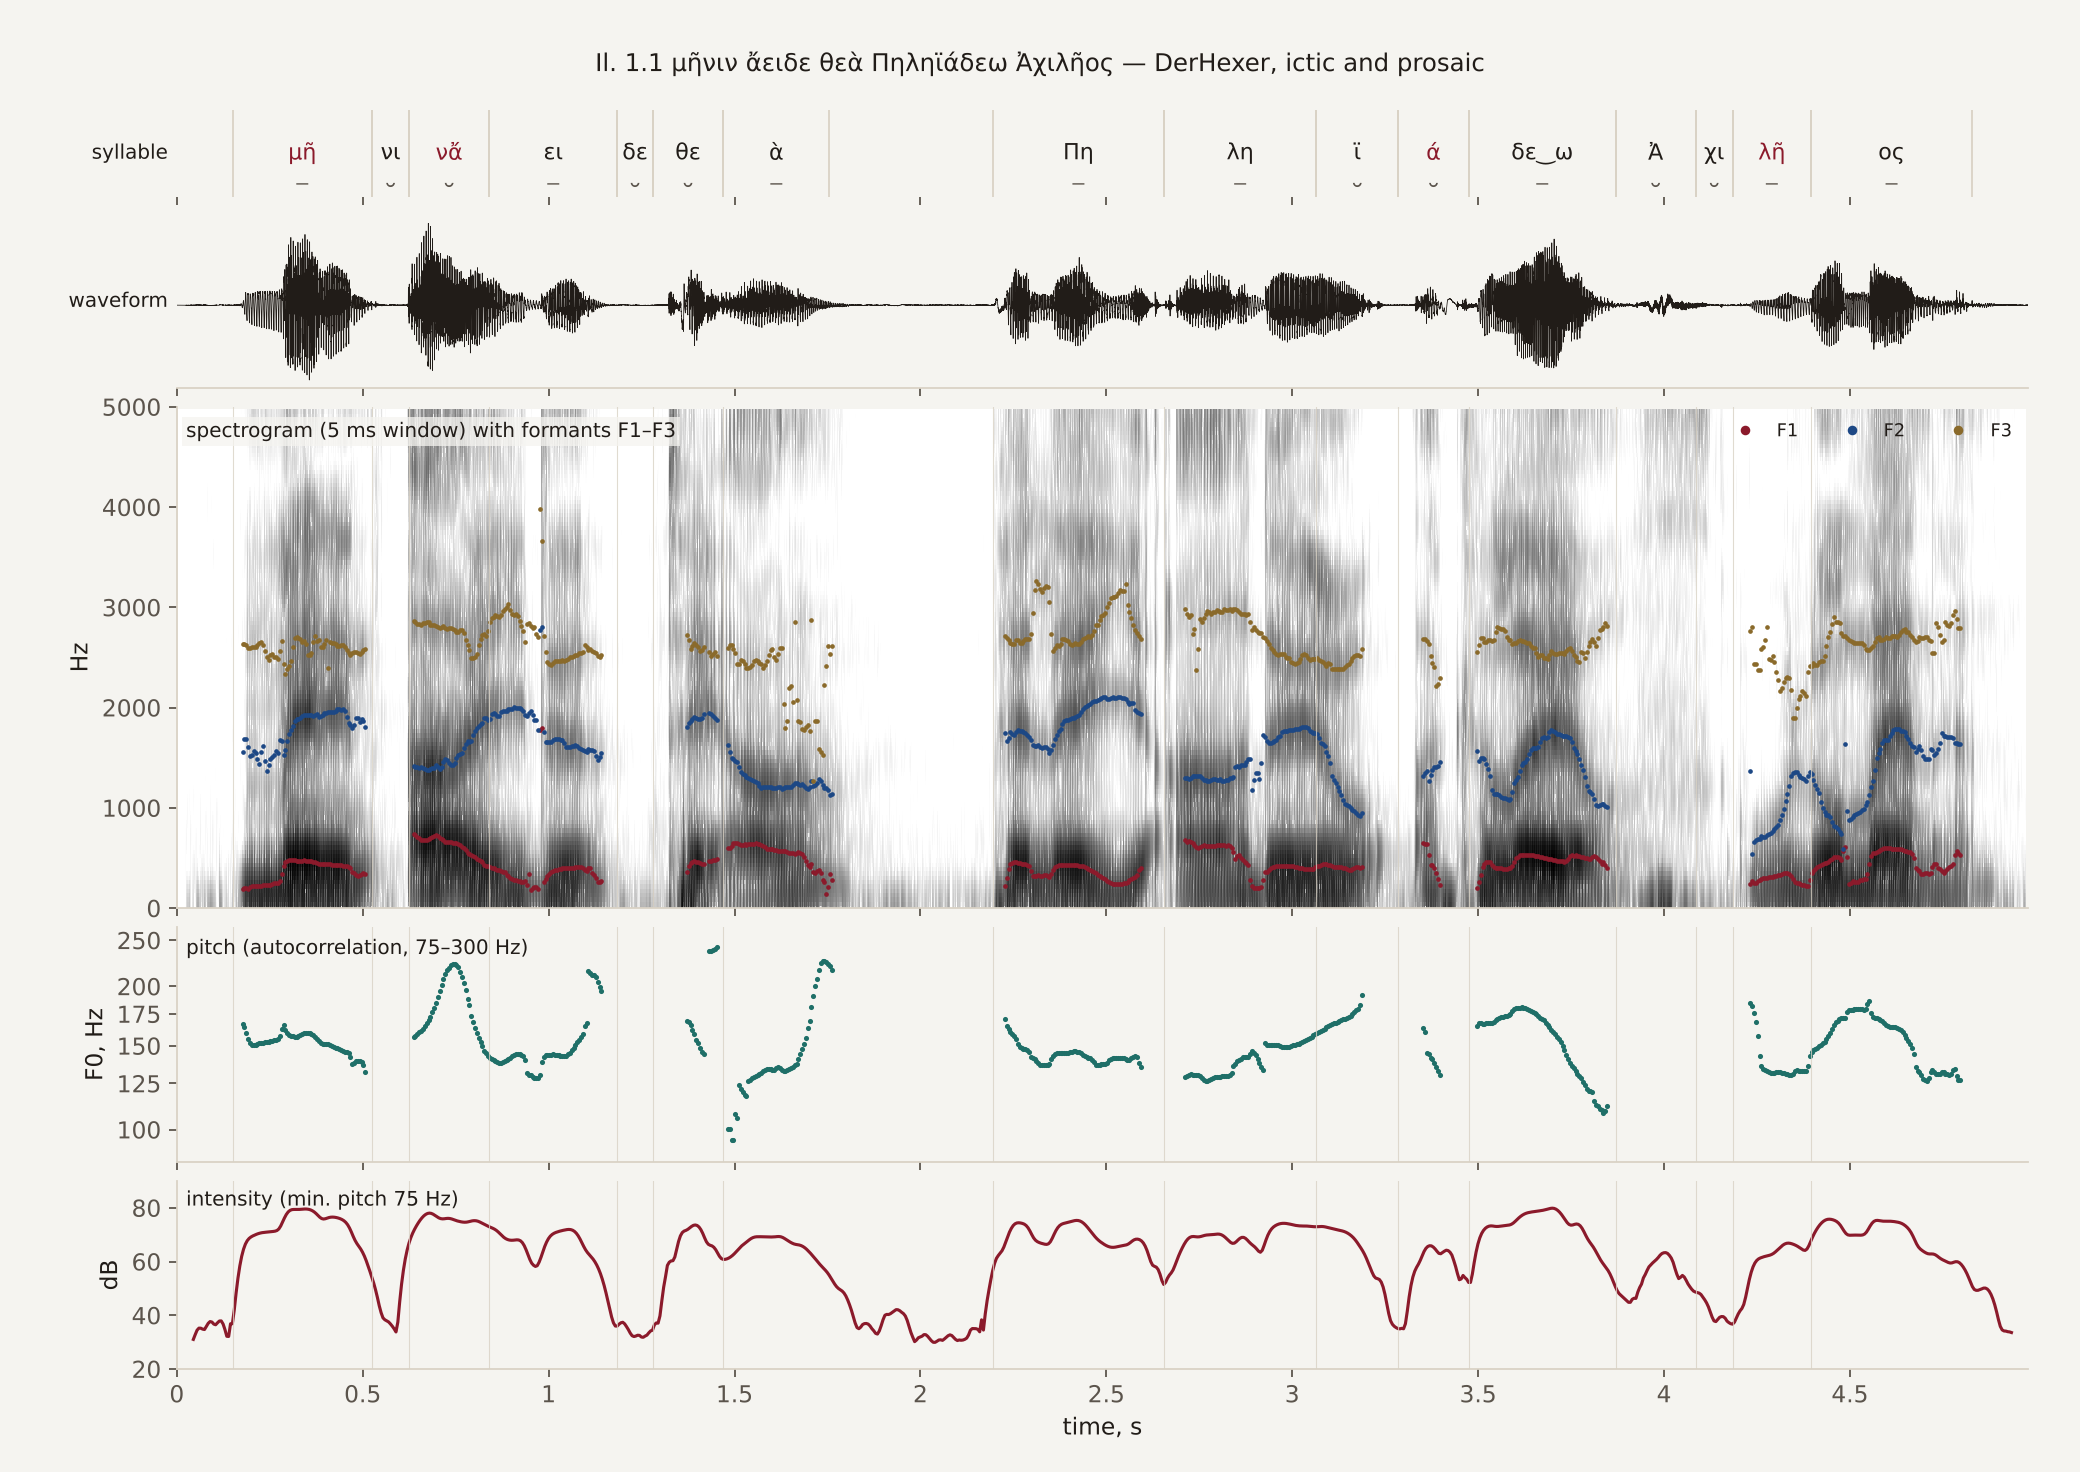
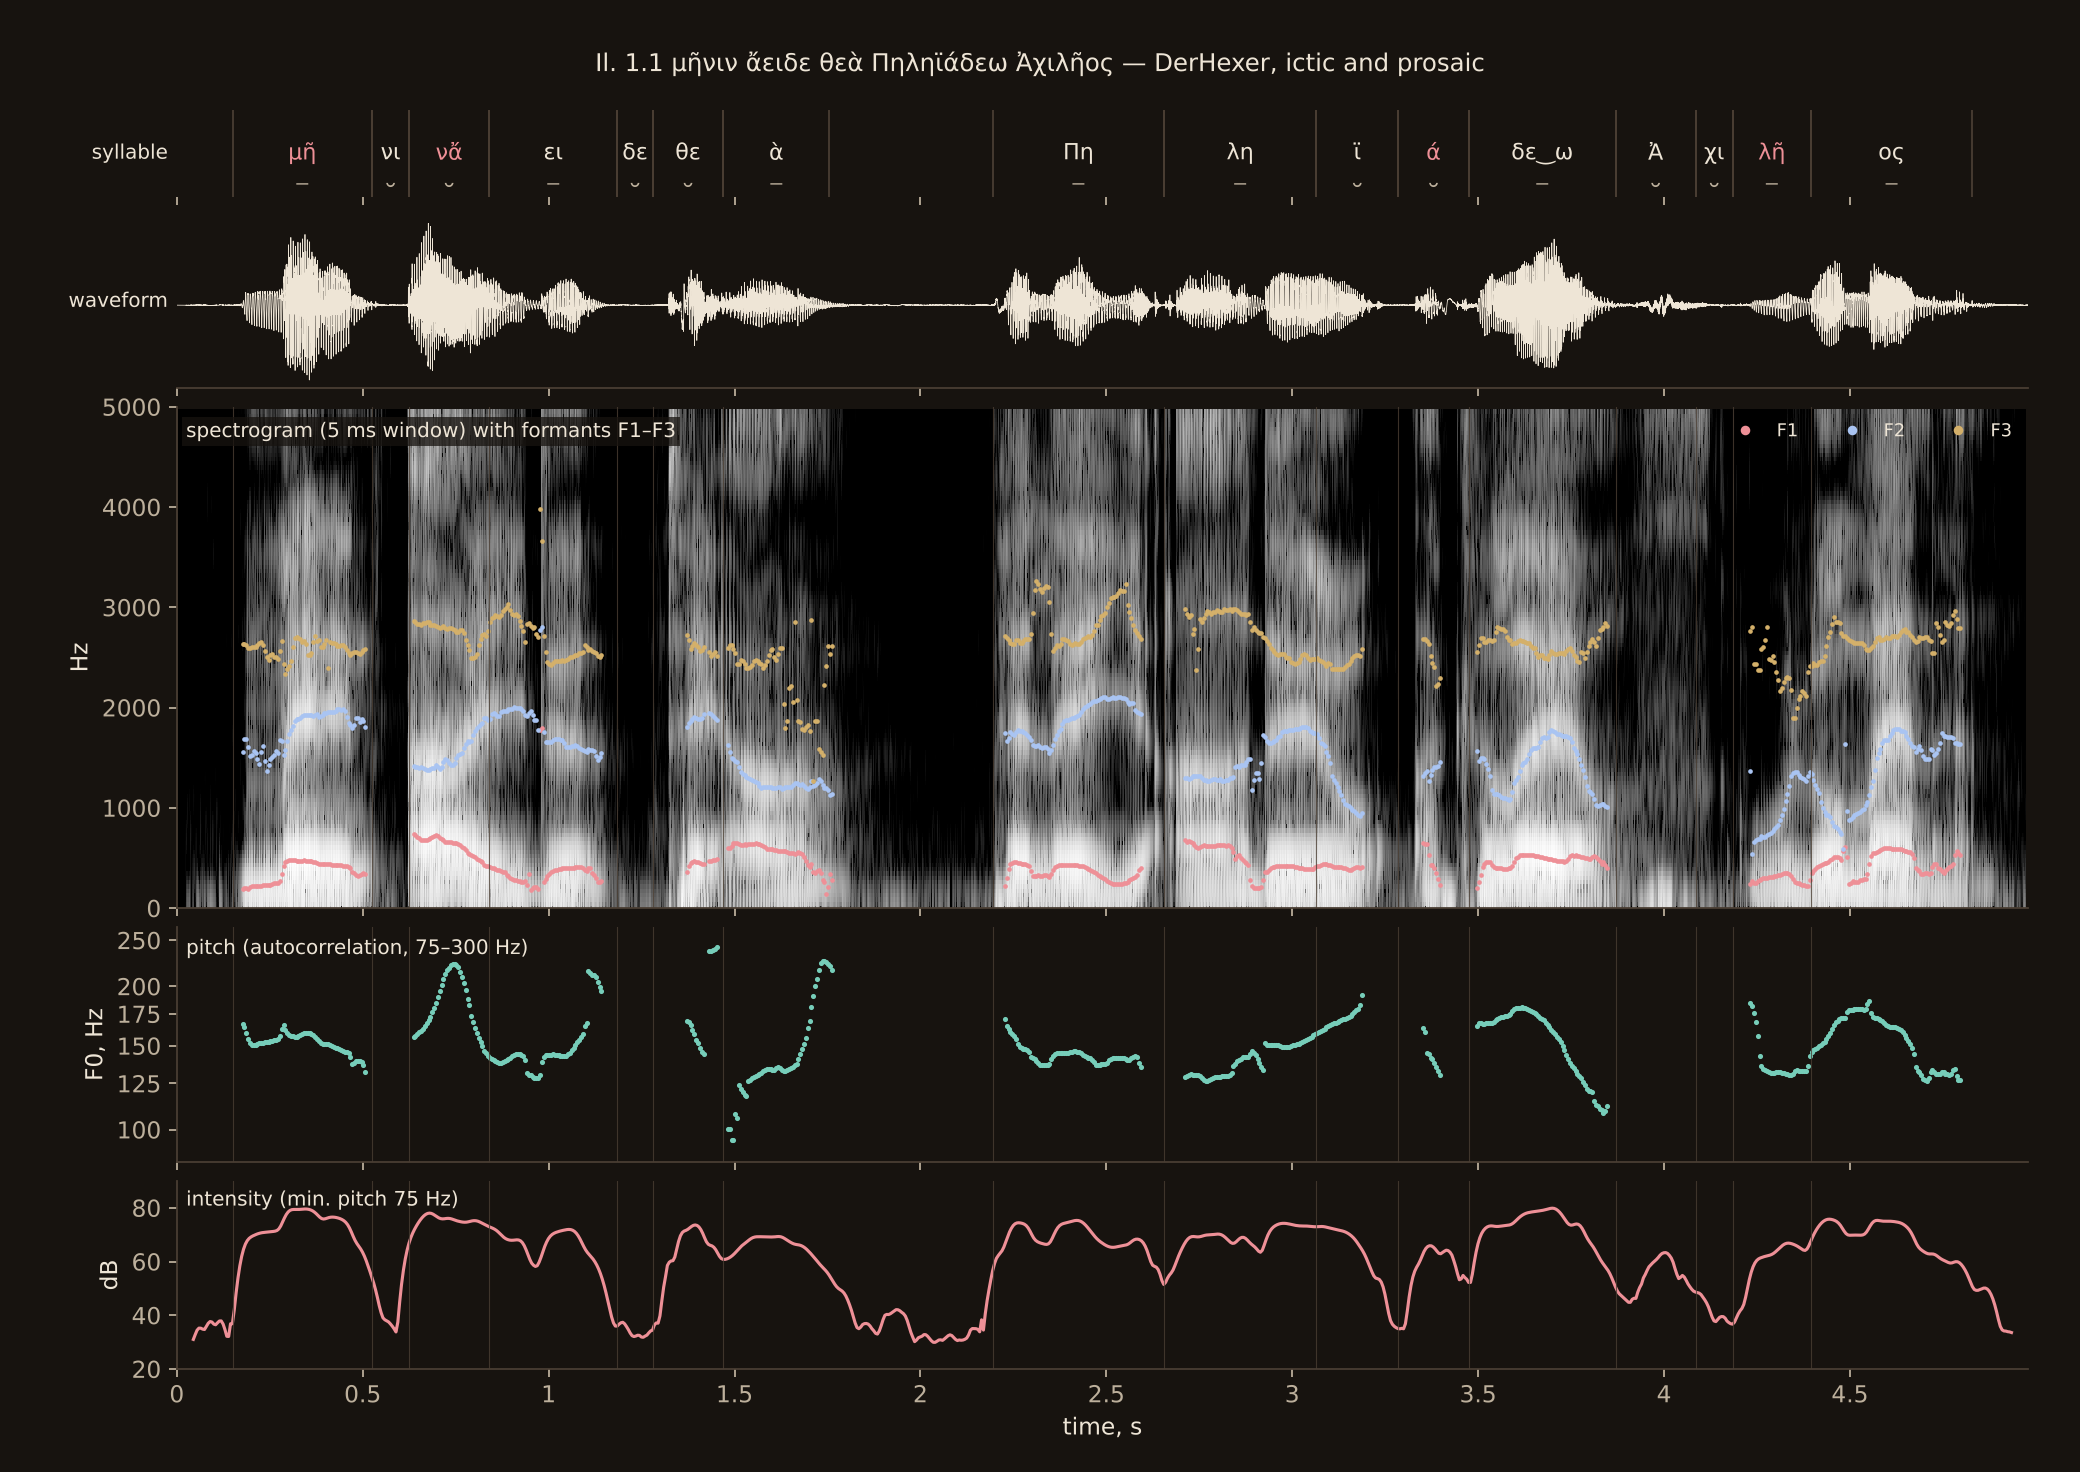
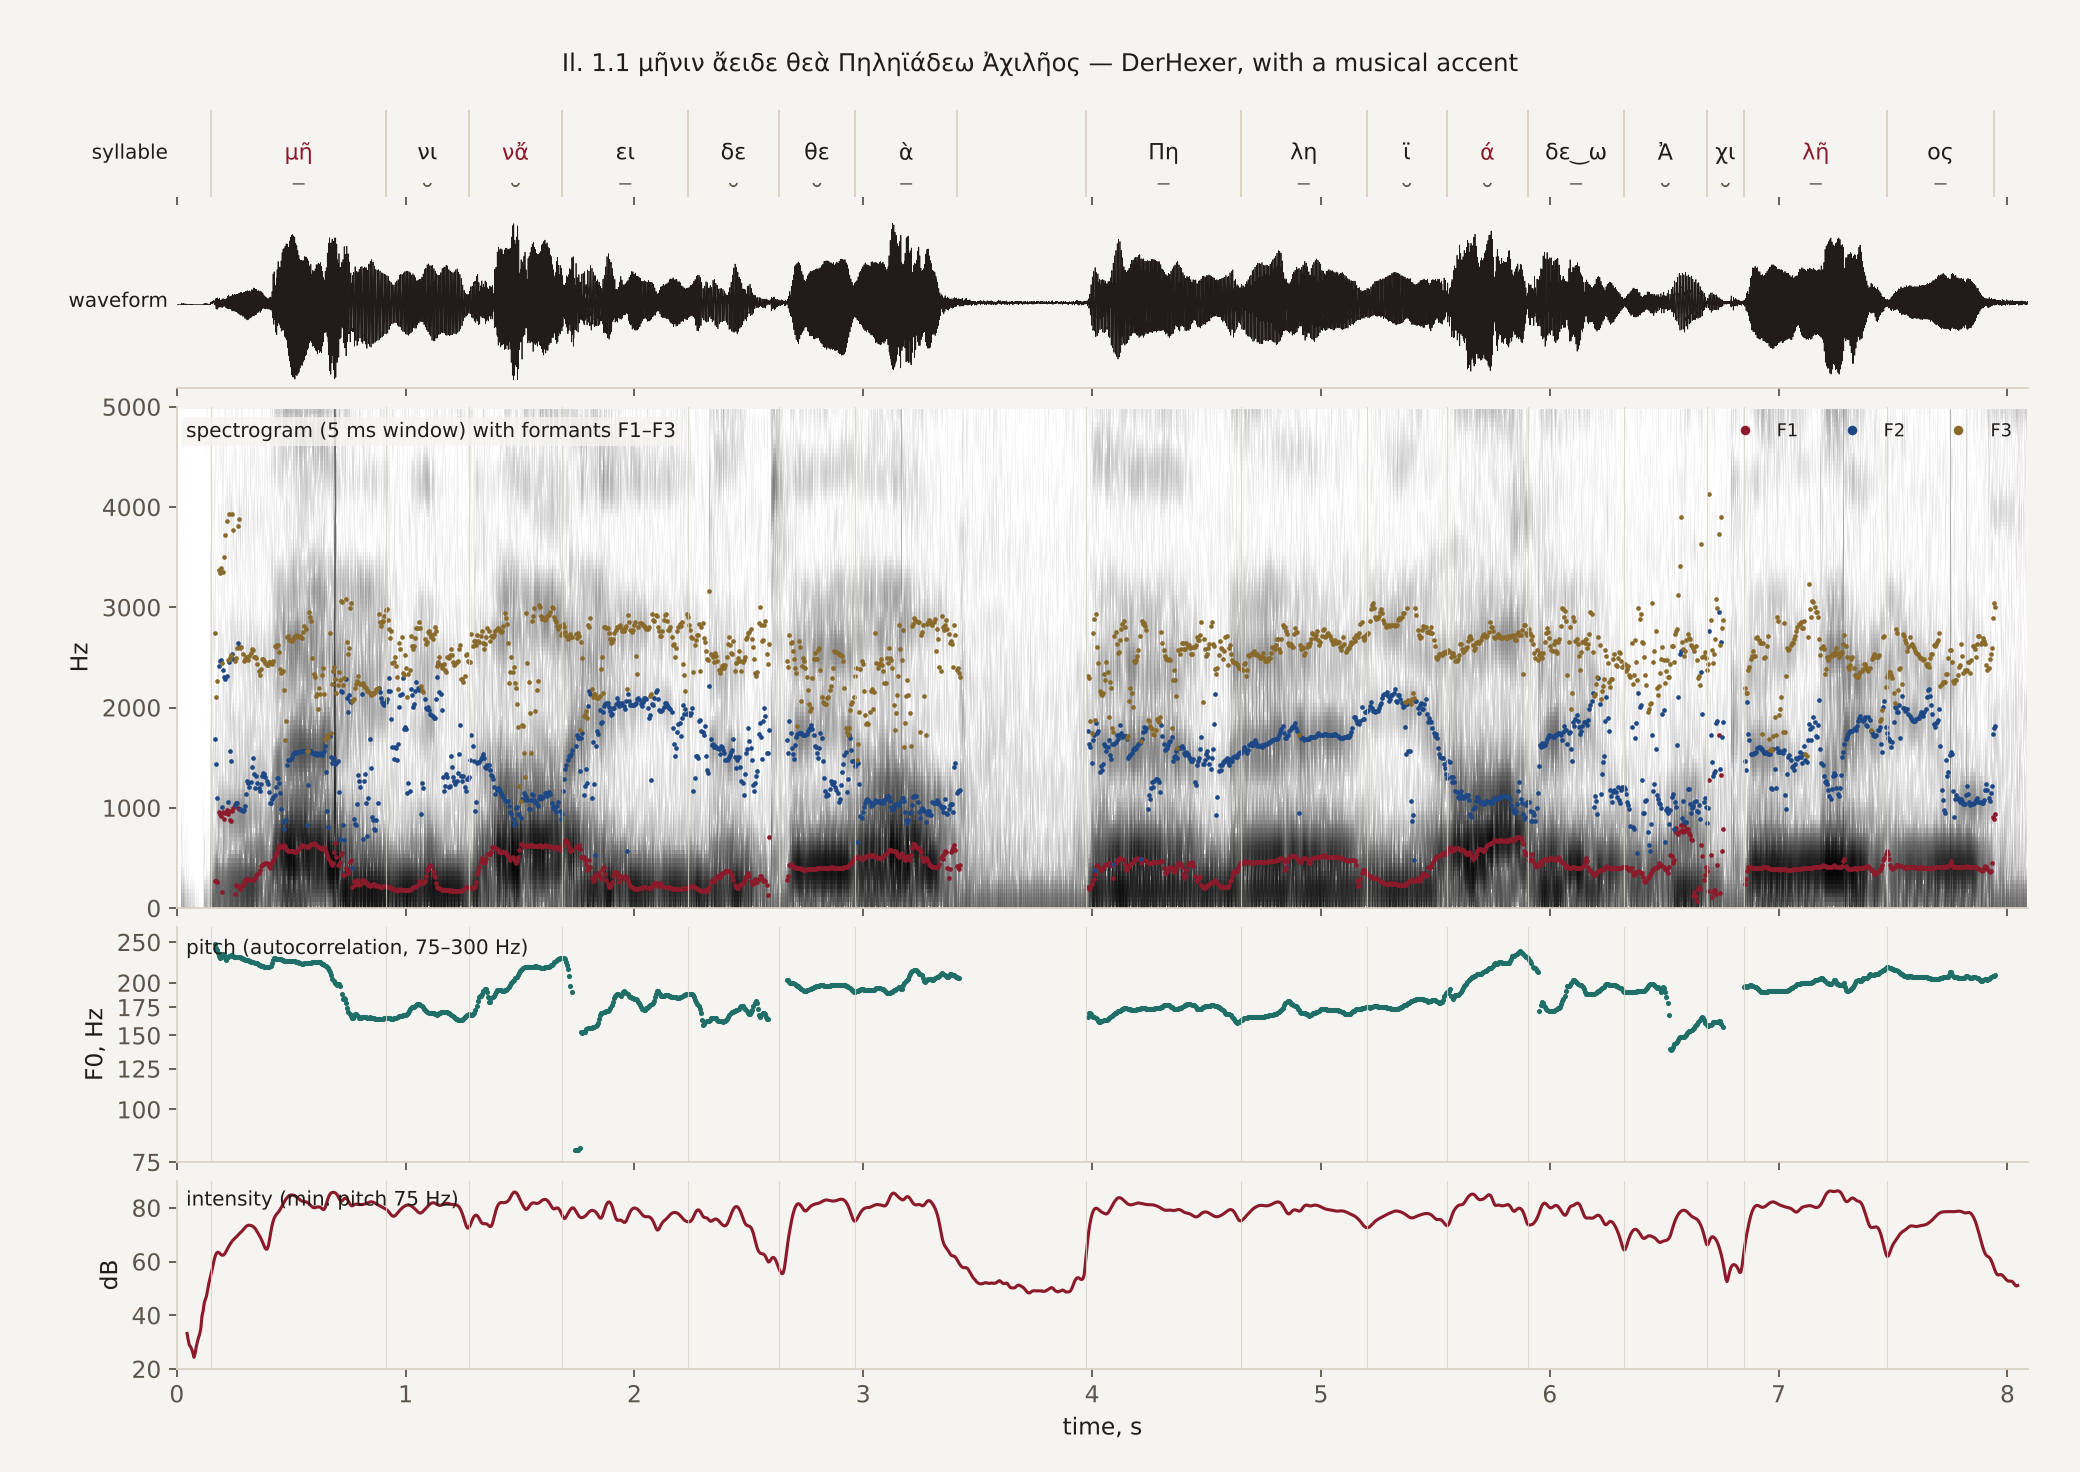
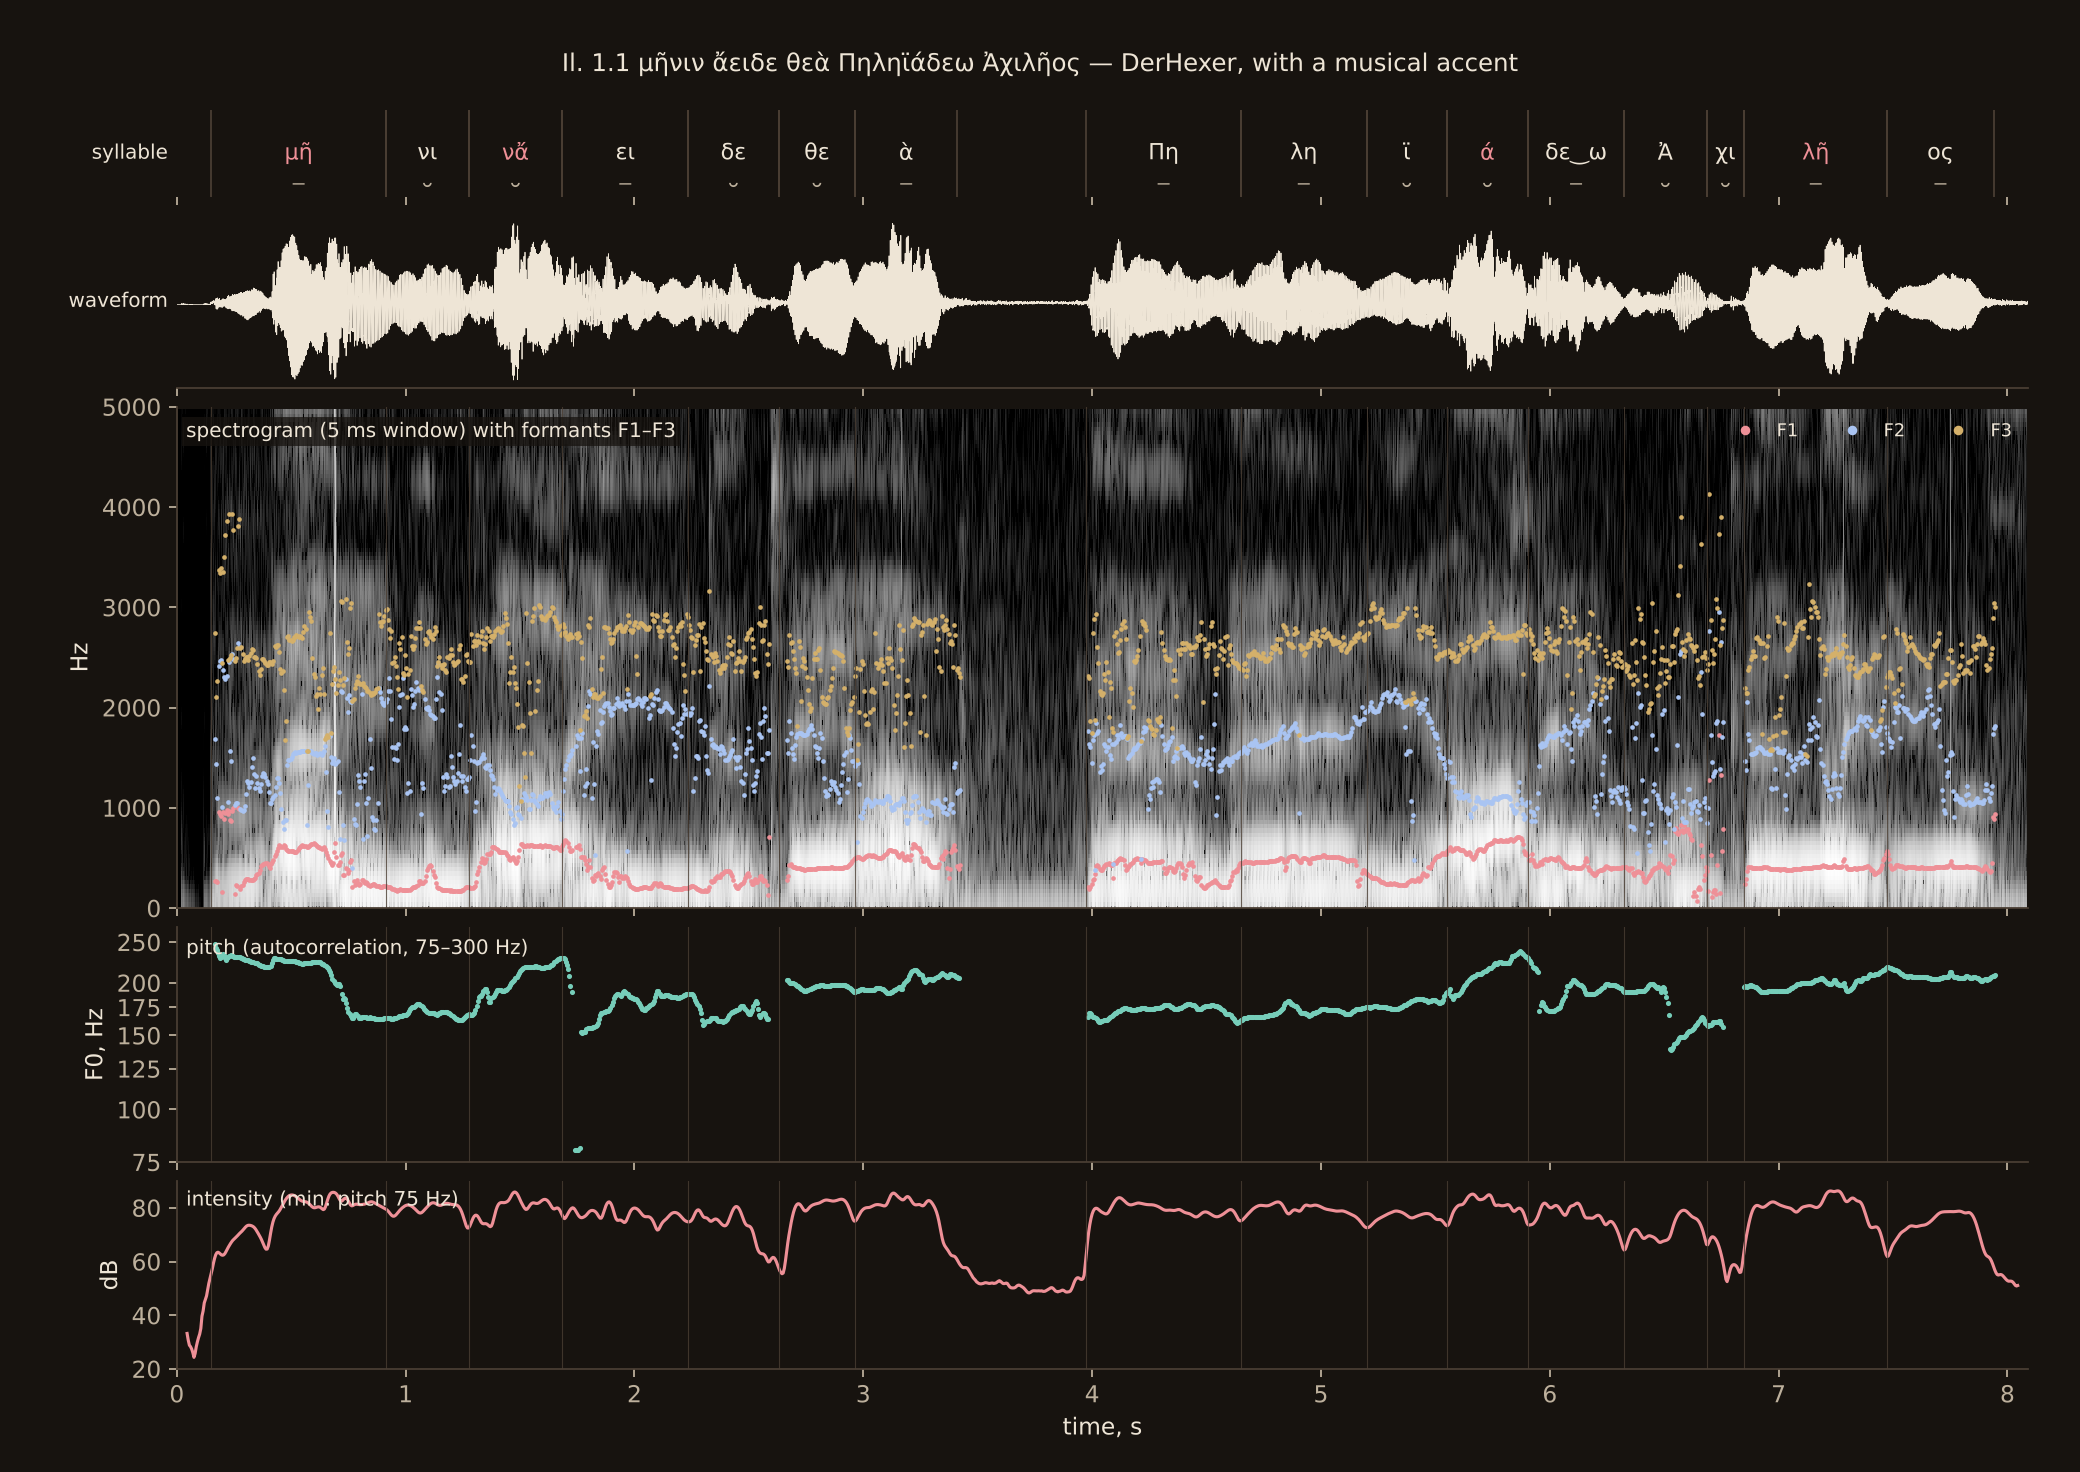
Synizesis is the running together of two vowels into one syllable. In this line the -εω of Πηληϊάδεω must be said as a single long syllable, or the line has too many syllables for the metre.
The Odyssey, restored and modern
The second pair reads the first line of the Odyssey. David Chamberlain reads it as he reads the Iliad, in a restored pronunciation with a light pitch accent. Eleni Kemiktsi reads for LibriVox, the volunteer project whose recordings are all in the public domain in the United States. She uses the Modern Greek pronunciation, in which the accent is a stress. The Pronunciation systems page compares the two pronunciations.
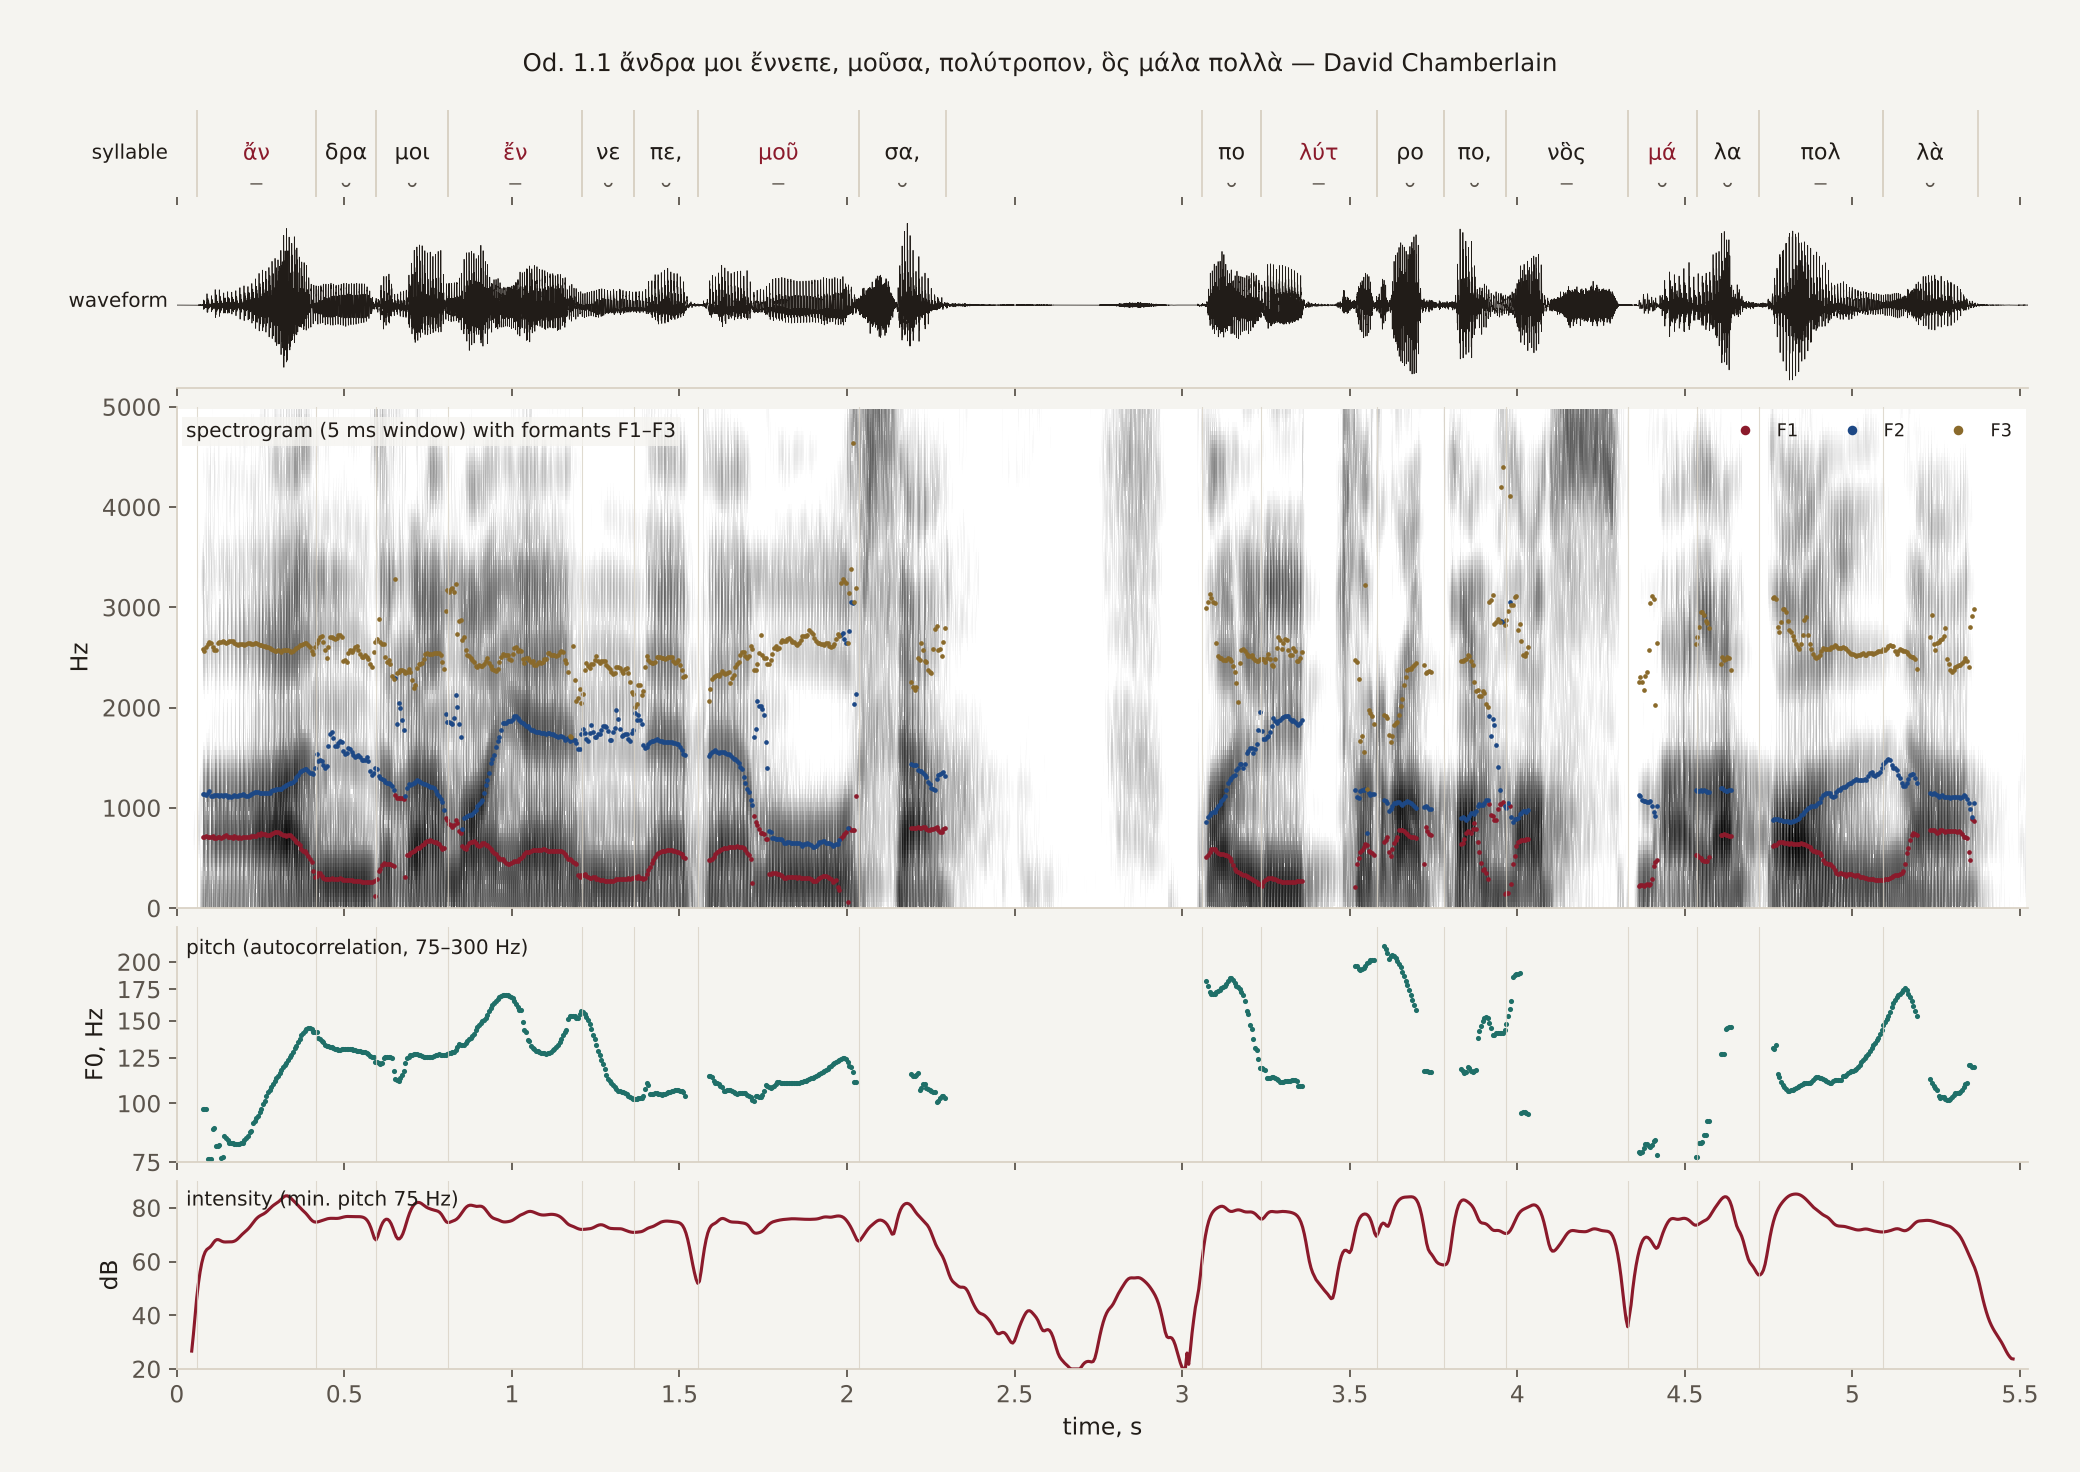
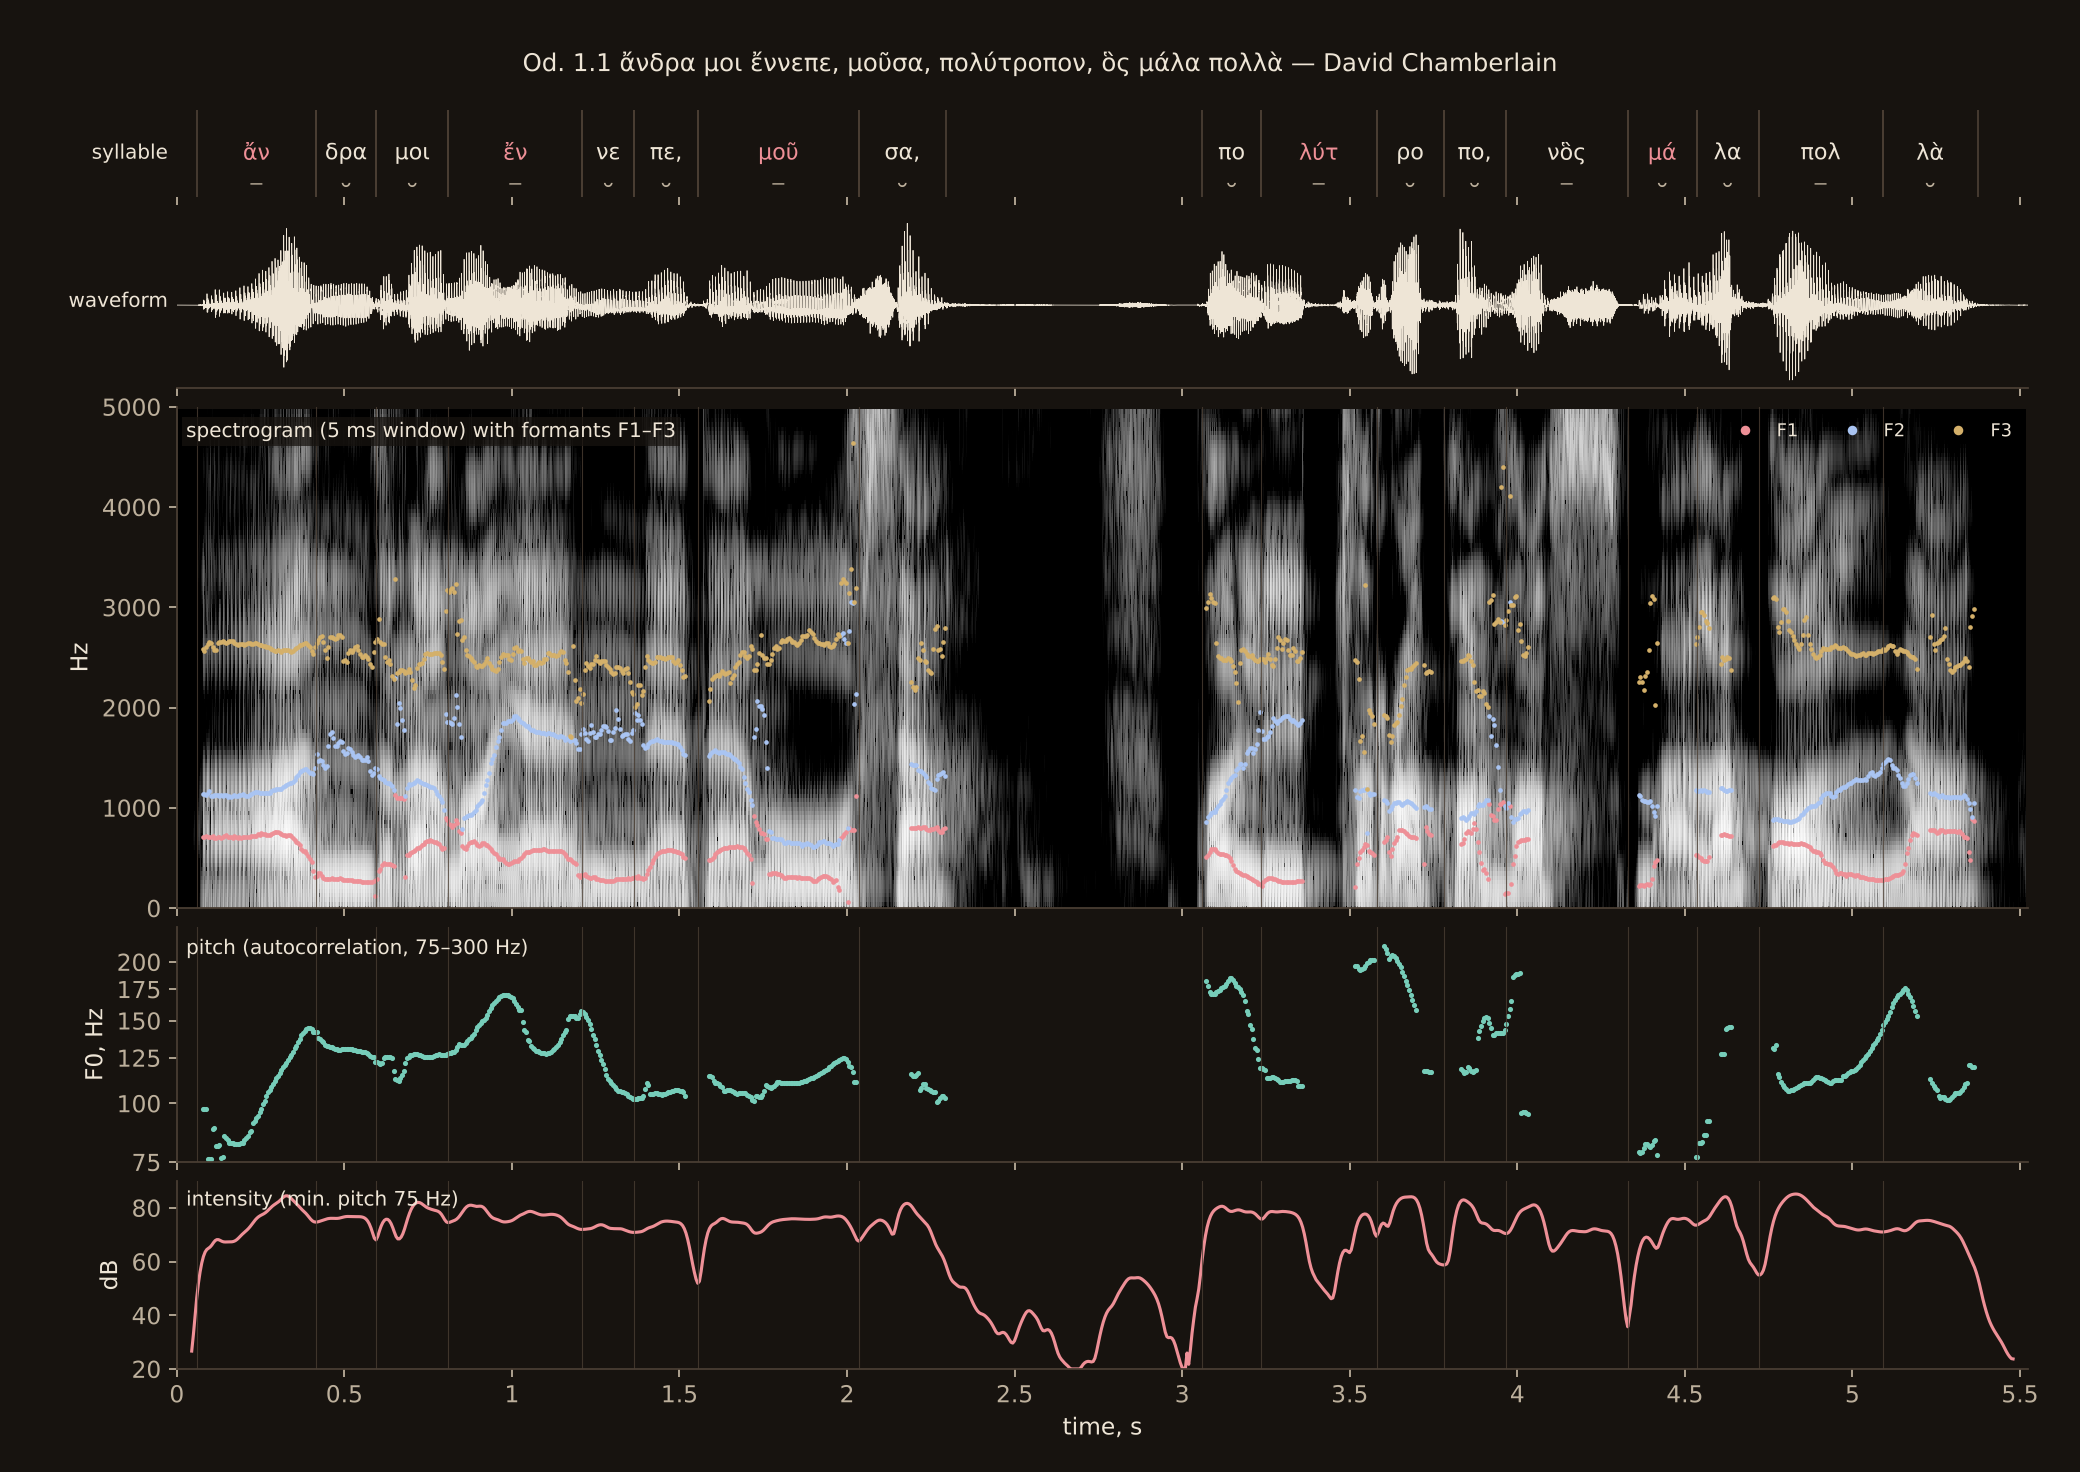
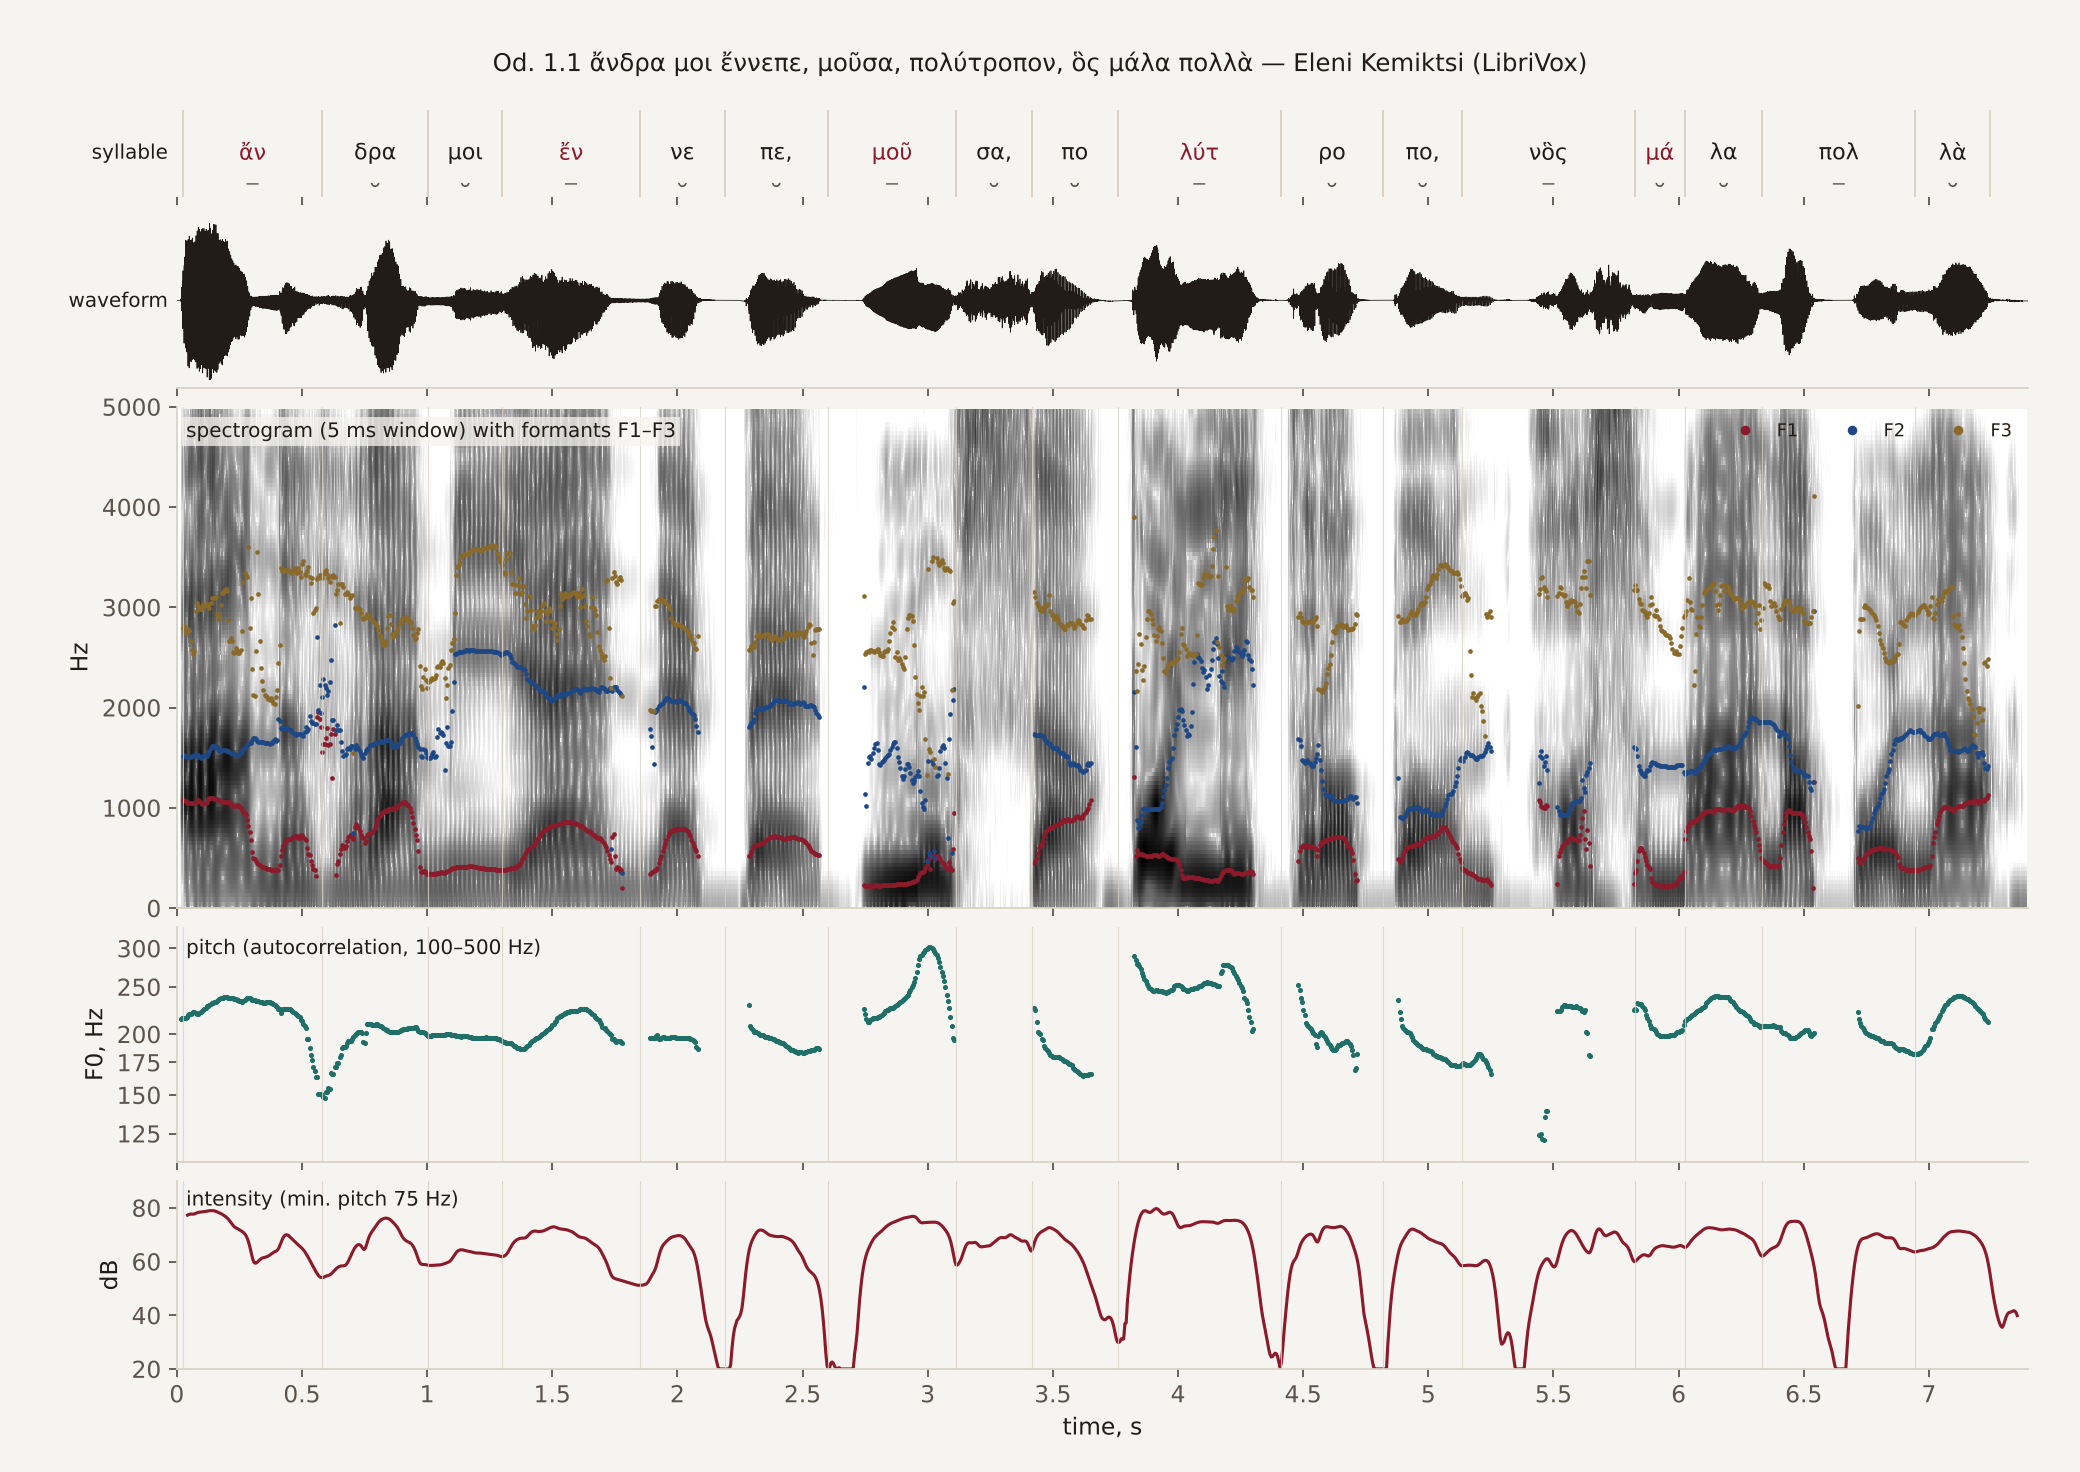
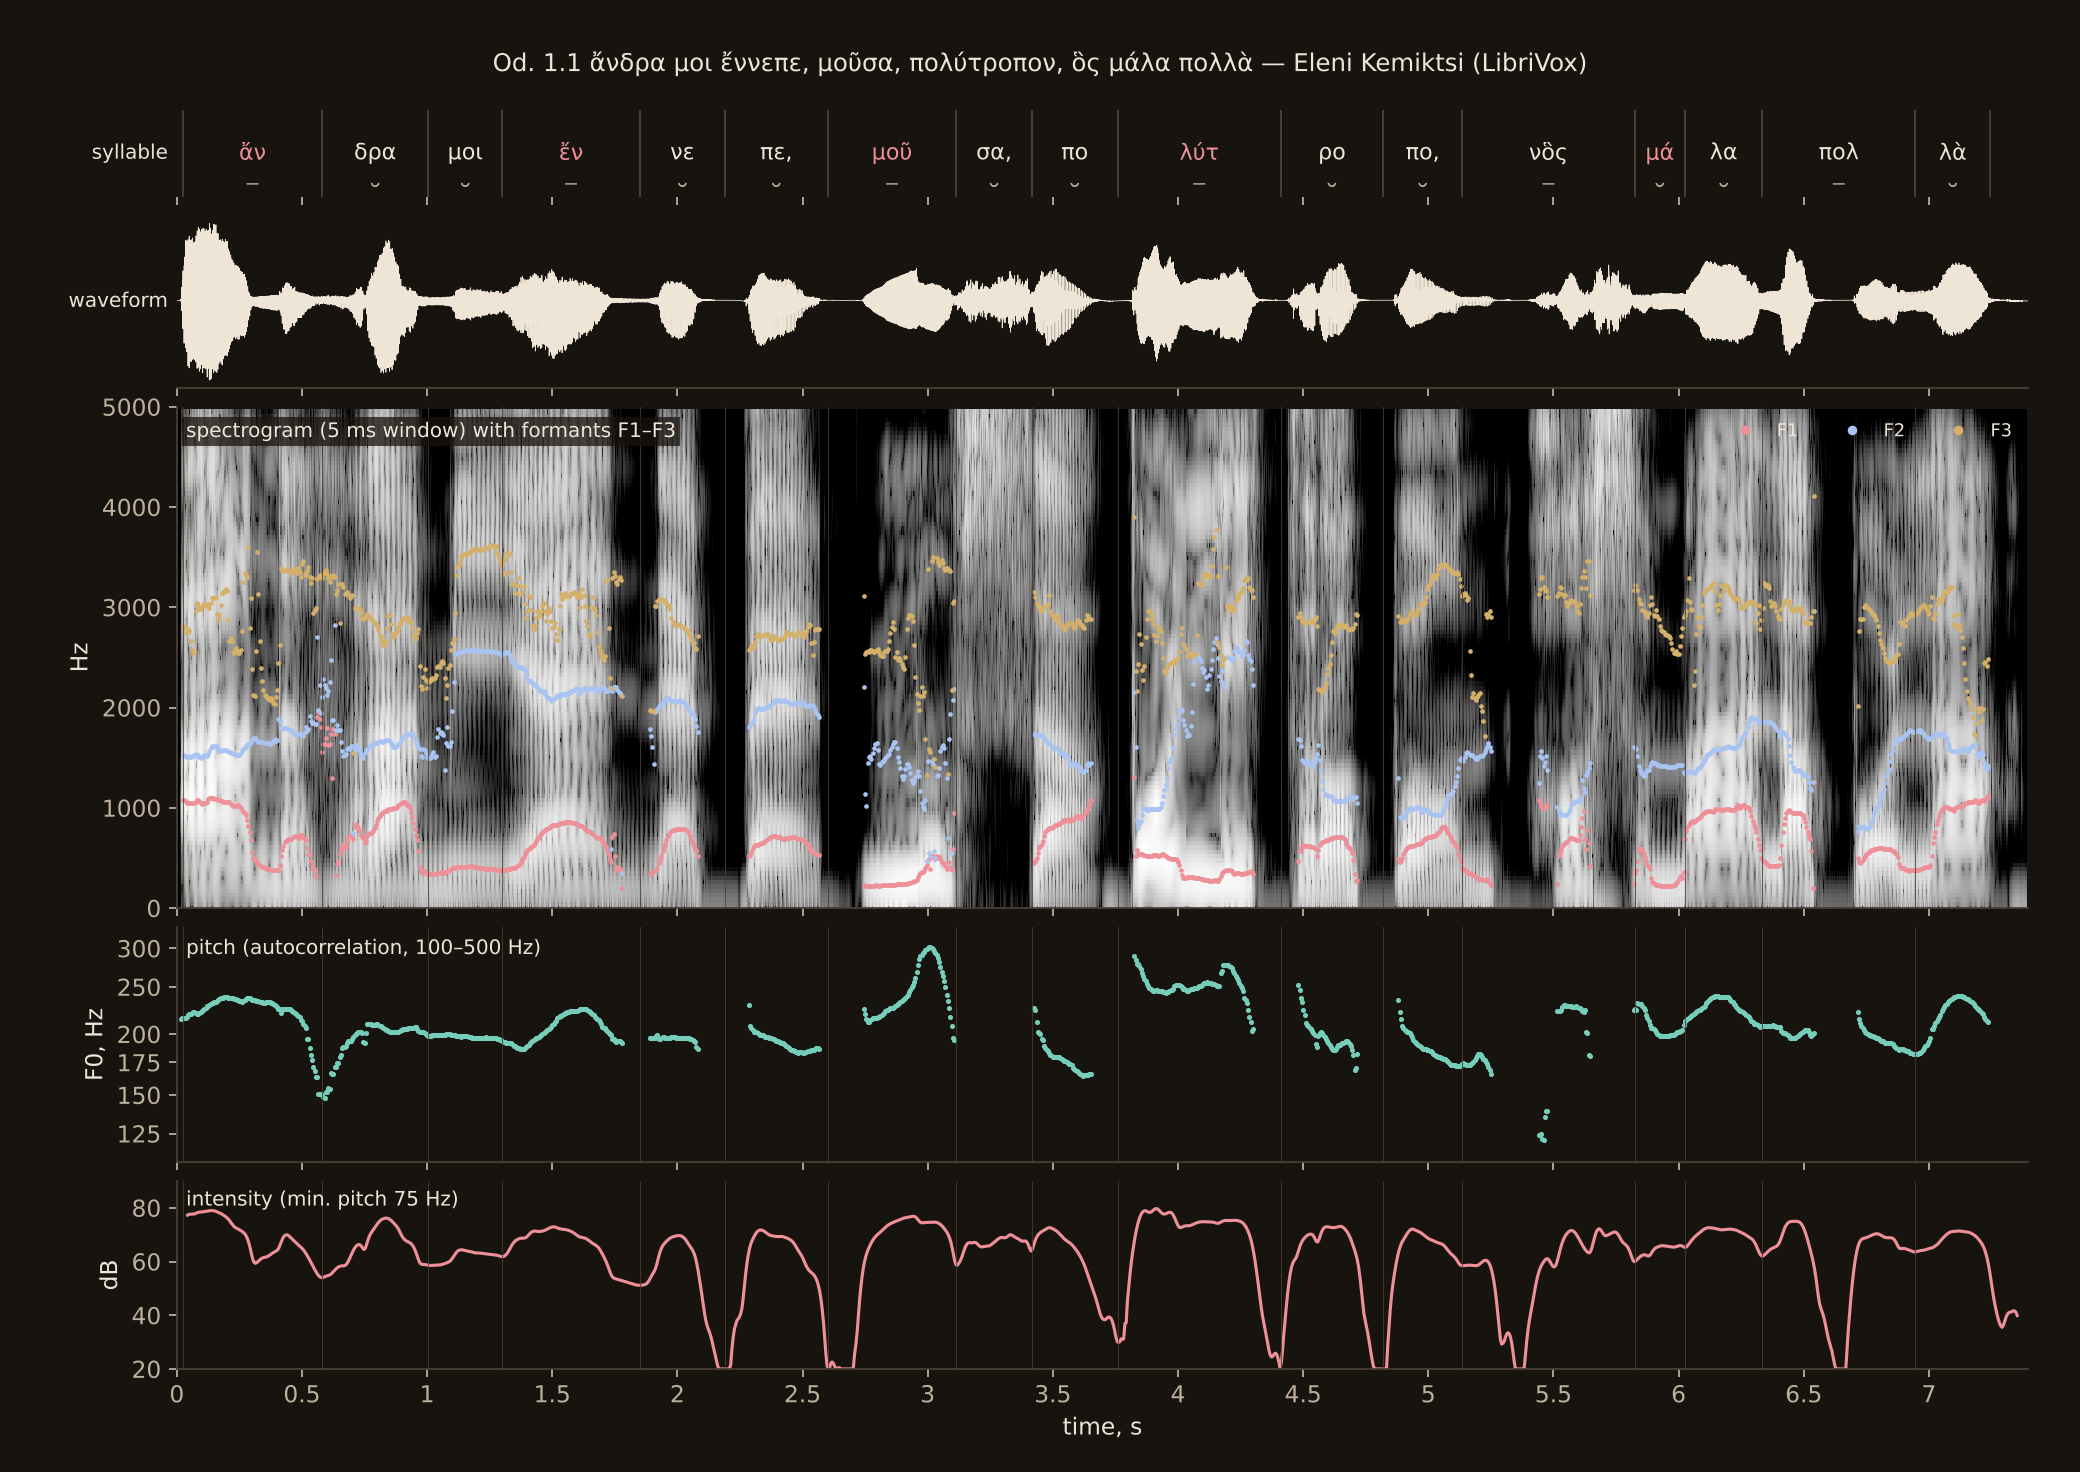
Listen to μοῦσα and πολύτροπον in the second reading. The accented syllables μοῦ- and -λύ- are the highest points of the pitch, and they are also among the loudest moments of the line. Chamberlain’s reading moves its pitch more widely, while his loudness stays much the same.
The readers measured
Measured The same Praat settings were used for every reader. The first columns give the pace and the range of each reading. The last three columns depend on where the syllables fall, which is measured approximately.
| Reader | Lines | Time per line (s) | Syllables a second | Middle of the voice (Hz) | Pitch range (st) | Pitch and loudness together (r) | Accented syllables: pitch (st) | Accented syllables: loudness (dB) | Princeps: loudness (dB) |
|---|---|---|---|---|---|---|---|---|---|
| David Chamberlain | Il. 1.1–7 | 4.7 | 3.3 | 134 | 14.4 | +0.07 | +2.9 | +1.8 | +1.9 |
| DerHexer, ictus, in rhythm | Il. 1.1–7 | 6.6 | 2.4 | 145 | 8.1 | +0.02 | −1.1 | −0.6 | +1.9 |
| DerHexer, ictus, as prose | Il. 1.1 | 4.7 | 3.8 | 149 | 8.4 | +0.30 | −1.3 | −0.6 | +4.1 |
| DerHexer, pitch accent, in rhythm | Il. 1.1 | 7.8 | 2.2 | 173 | 5.7 | −0.07 | +2.8 | +4.1 | +2.6 |
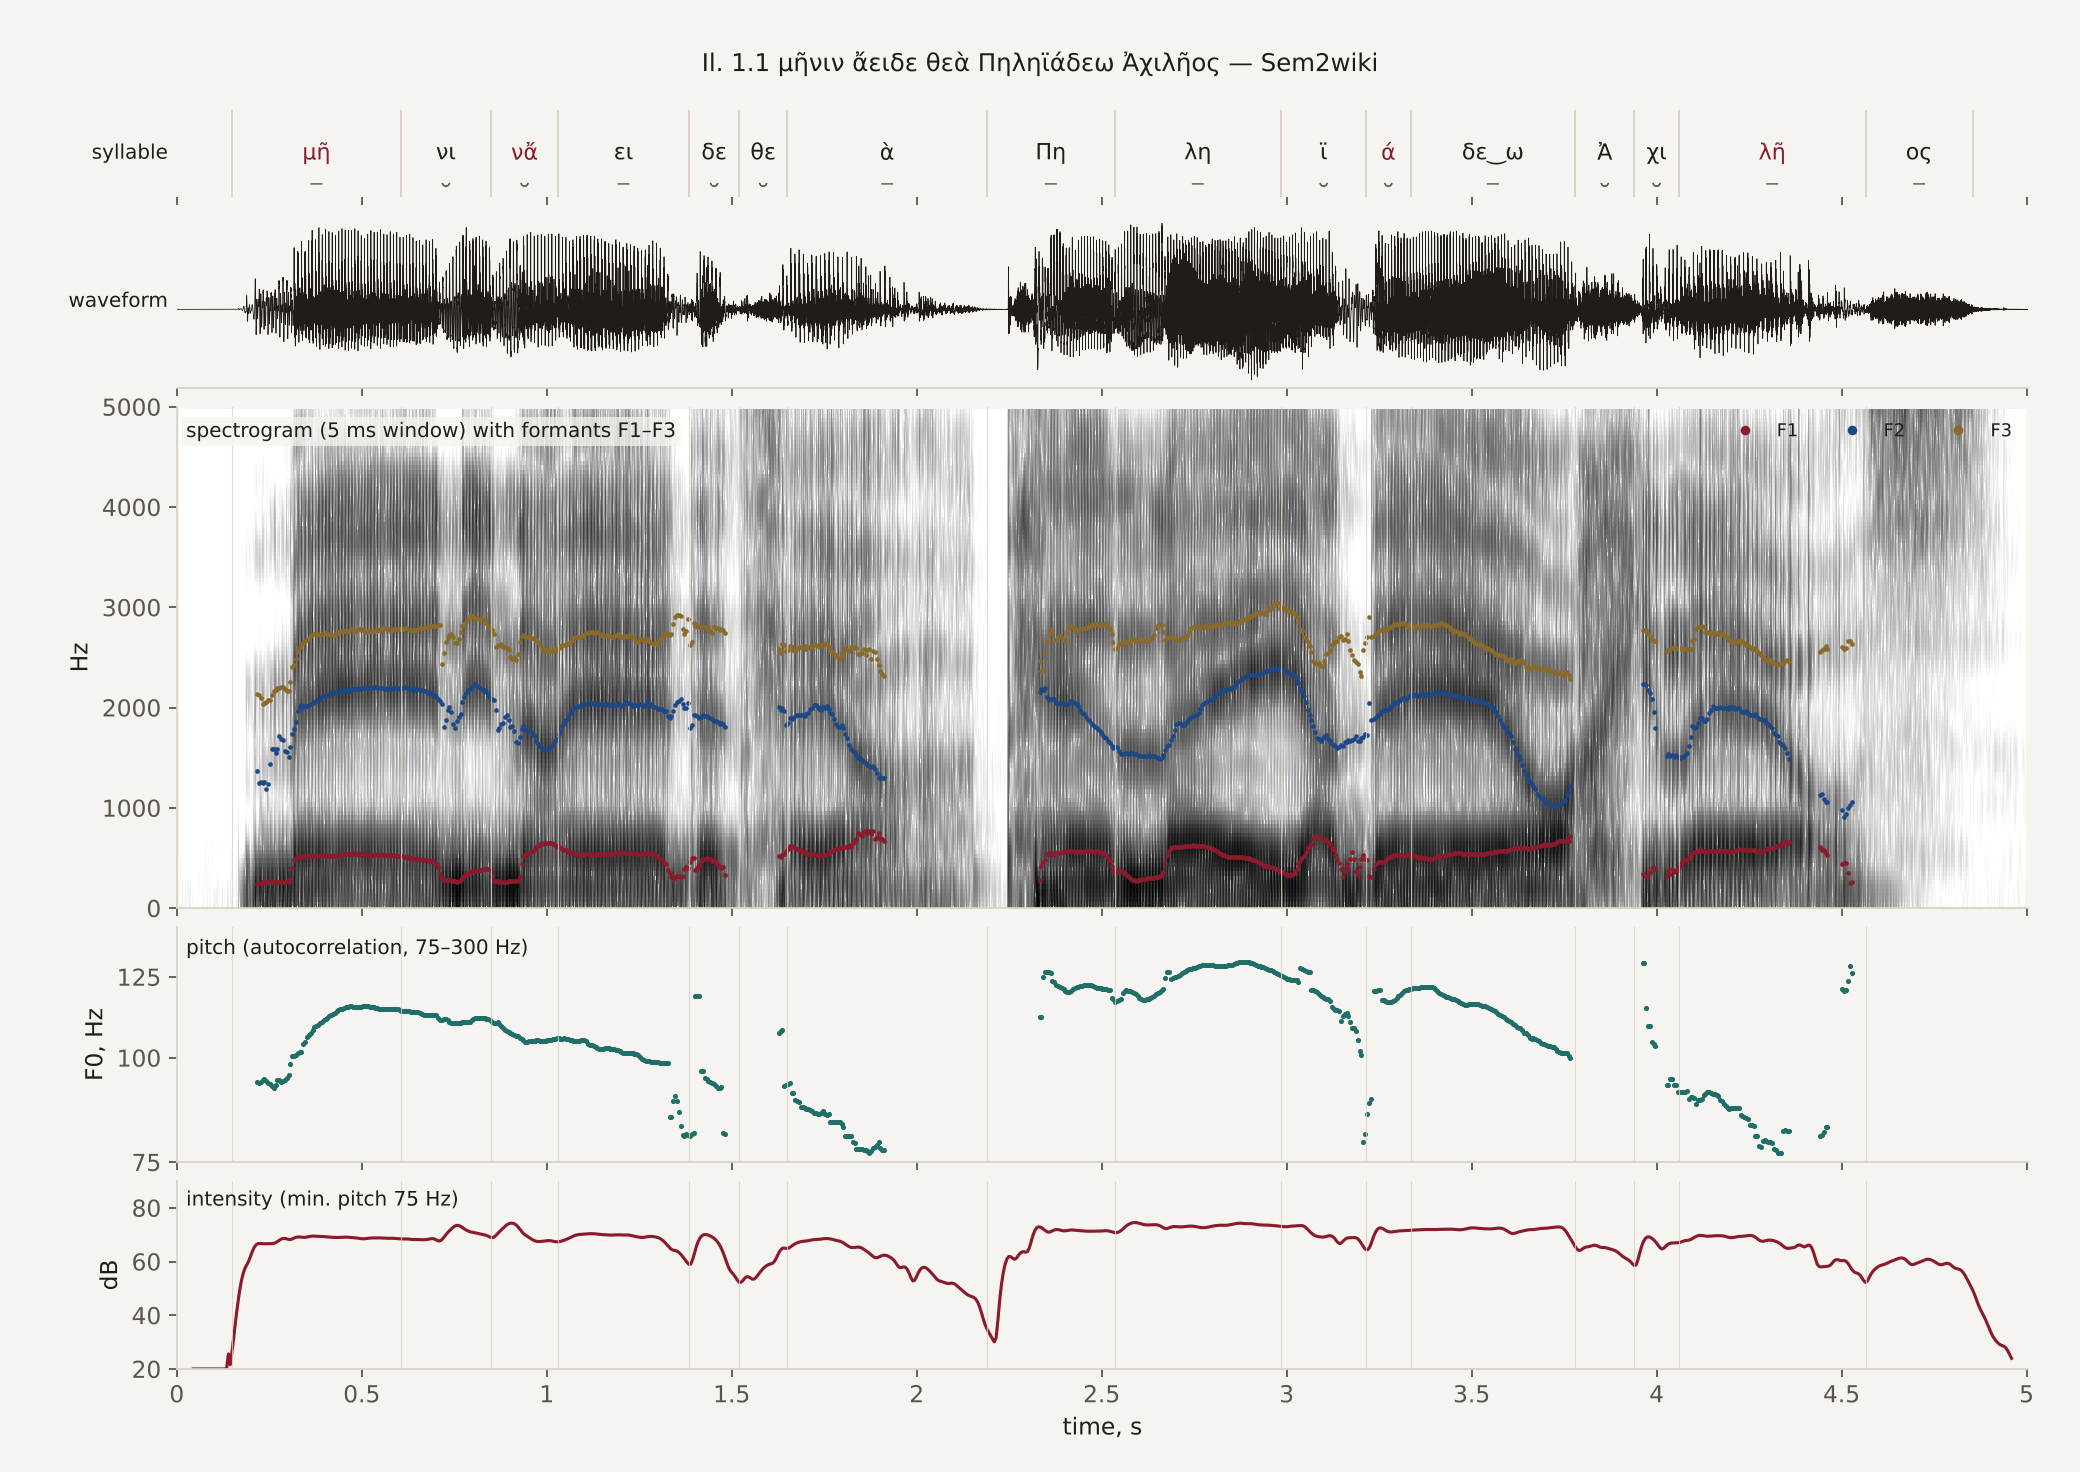
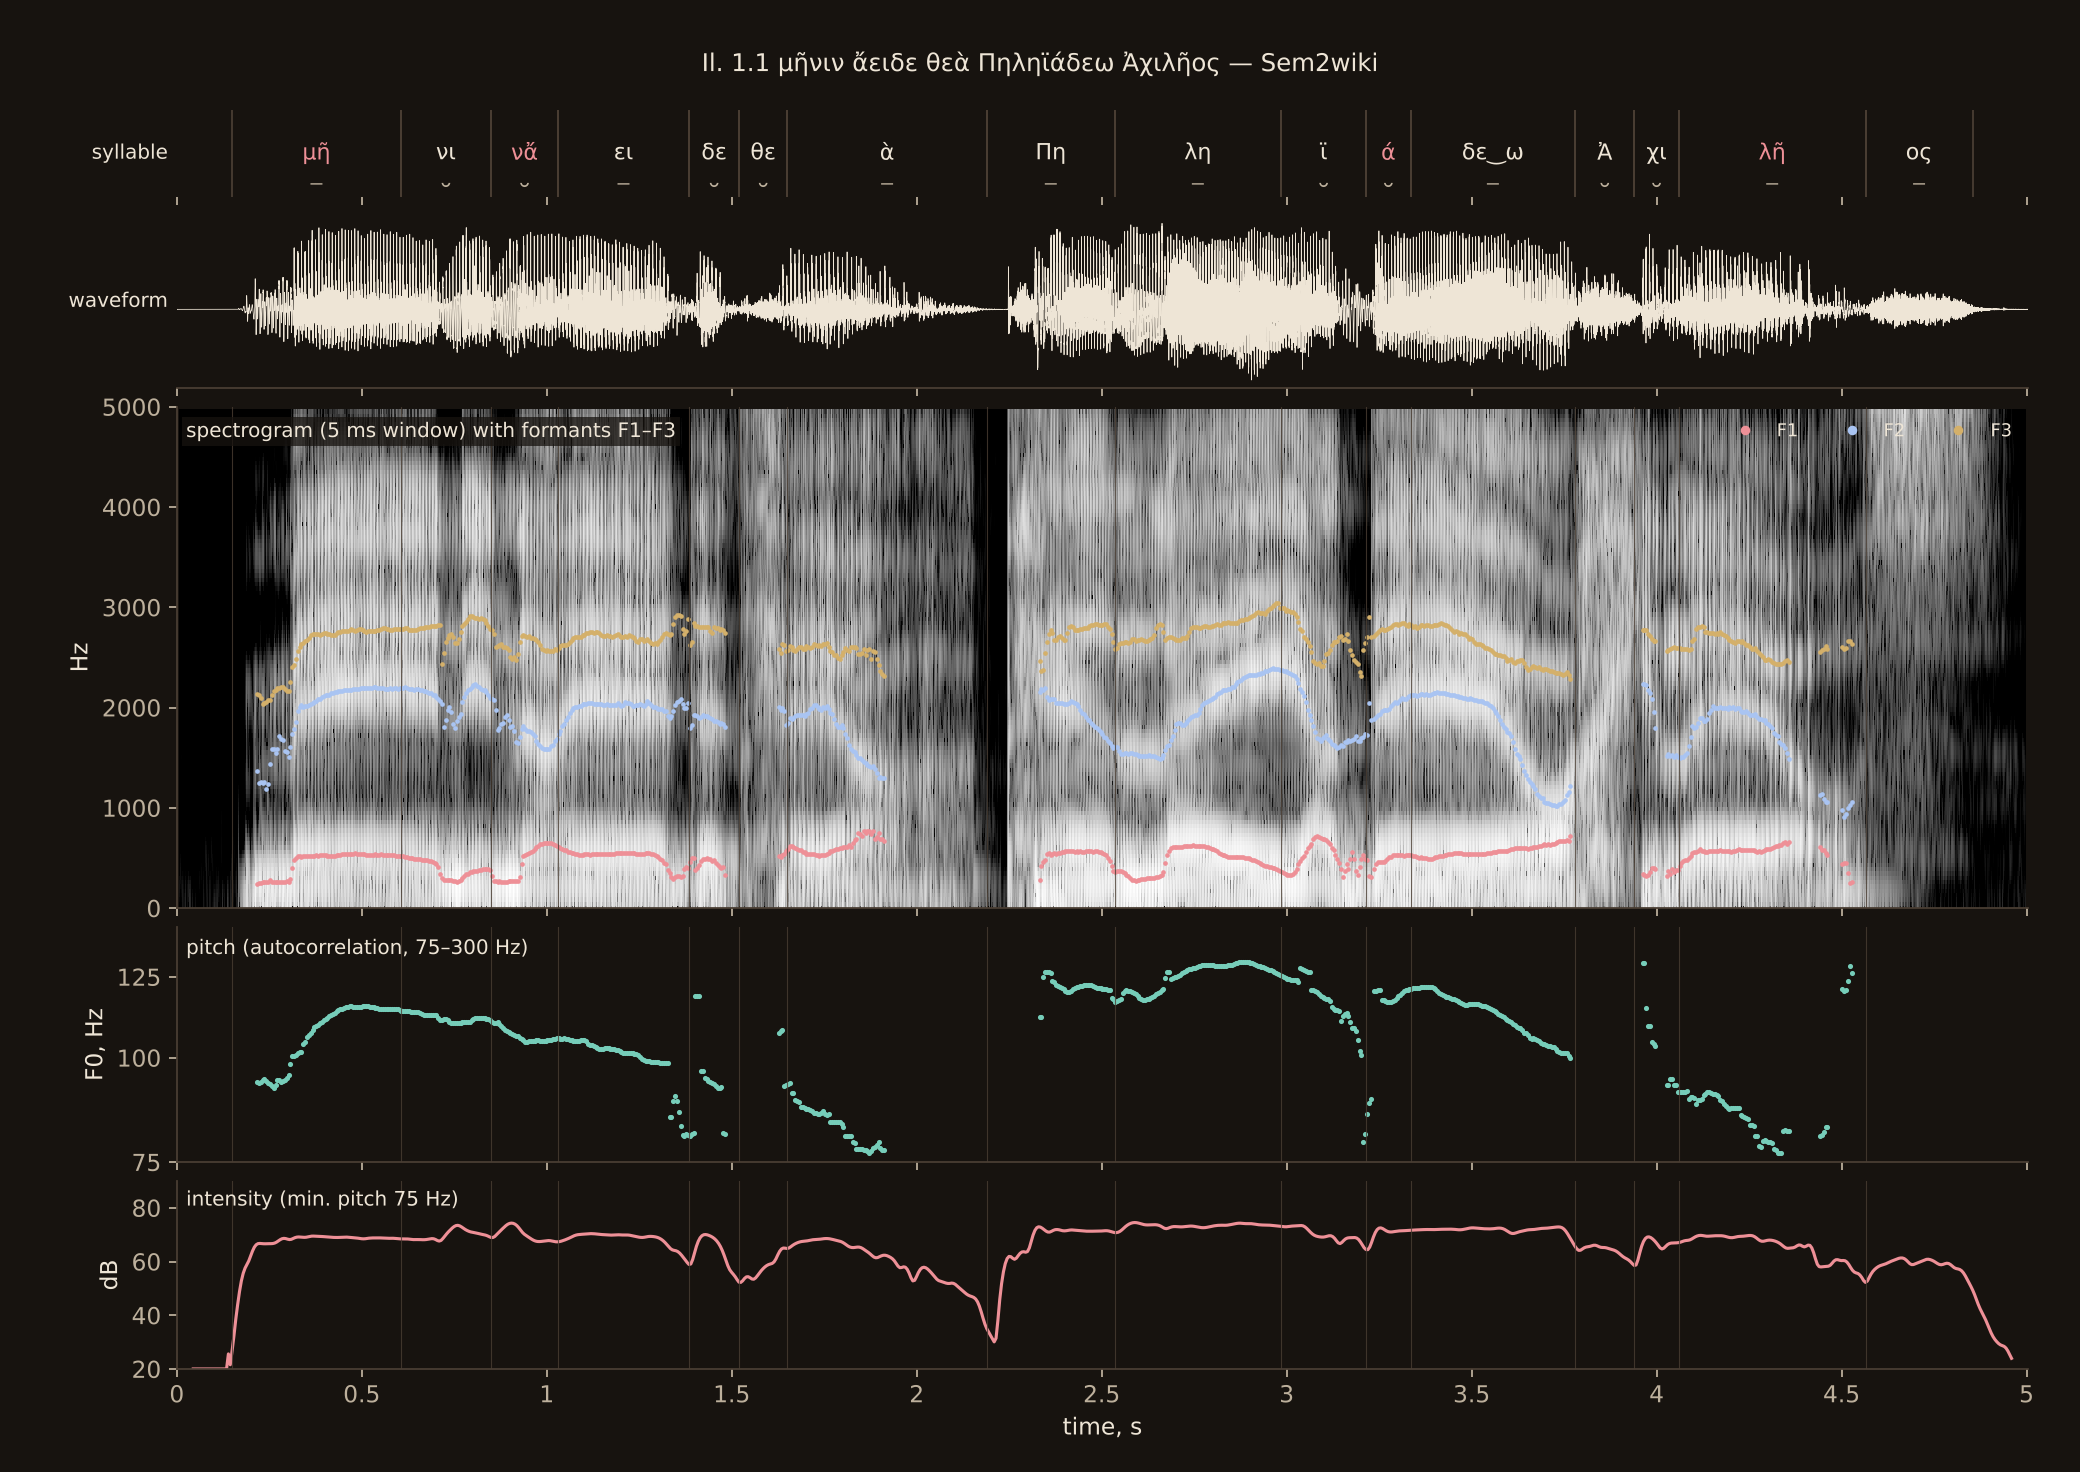
| Sem2wiki | Il. 1.1 | 4.7 | 3.4 | 110 | 8.1 | +0.25 | −0.5 | +0.7 | −1.2 |
| David Chamberlain | Od. 1.1–10 | 5.2 | 3.3 | 153 | 17.9 | −0.01 | −1.2 | +0.7 | +0.6 |
| Eleni Kemiktsi | Od. 1.1–10 | 6.8 | 2.6 | 201 | 10.0 | +0.21 | +1.2 | +1.9 | +5.1 |
The pitch range runs from the 5th to the 95th centile of the voice, in semitones. The column “pitch and loudness together” is a correlation. It asks whether the voice gets louder whenever it rises, after the slow fall through each line has been taken out. A value near 0 means that pitch and loudness move independently. A value near +1 would mean that they always move together. The accent columns give the accented syllables’ median pitch and peak loudness, less those of the unaccented ones. The last column does the same for the princeps syllables against all the others.
Three things stand out.
- Chamberlain’s melody is the widest. His voice ranges over 14 to 18 semitones. The other readers stay within 6 to 10.
- Pitch and loudness part company in the pitch-accent readings. In both of Chamberlain’s readings, and in DerHexer’s reading with a musical accent, the correlation is close to zero. It is clearly positive in DerHexer’s prose reading with an ictus (+0.30), in Sem2wiki’s line (+0.25) and in Kemiktsi’s modern reading (+0.21). DerHexer’s rhythmic reading with an ictus is the exception, at +0.02, so its beat is not made by raising pitch and loudness together.
- The ictus readings ignore the written accent. In both of DerHexer’s ictus readings the accented syllables are slightly lower and quieter than the rest. In his pitch-accent reading they are 2.8 semitones higher, and also 4 dB louder.
Some figures need care. Most of the samples are small. A single line has only about sixteen syllables, and fewer than half of them are accented. Chamberlain’s accented syllables stand high in the Iliad but low in the Odyssey lines, as his reading varies from passage to passage.[1] Kemiktsi’s princeps syllables are 5 dB louder than the rest, although she stresses the word accent, not the ictus. Part of the reason is that the two often coincide: 22 of the 60 princeps syllables in these ten lines carry the accent. Her modern syllables also do not always match the scansion’s, so the syllable-based columns are least reliable for her.
Hear the whole passages
- DerHexer, Iliad 1.1–7, with an ictus, in rhythm:
- DerHexer, Iliad 1.1–7, with an ictus, as prose:
- DerHexer, Iliad 1.1–7, with a musical accent:
- David Chamberlain, Odyssey 1.1–10:
- Eleni Kemiktsi, Odyssey 1.1–10:
Notes
- ^ See the previous tab.
6. Sound lab · 4 of 7
Recordings
Choose a work or search for a passage, then play its recording. The complete Iliad and Odyssey 1–7 are available by book and passage. Human readings and synthetic examples are labelled separately. Each recording links to its text and credits.
6. Sound lab · 5 of 7
Pitch accent in the recordings
This tab measures the pitch of every syllable in the recordings and sets it beside the written accents. Praat’s pitch track, taken every 5 ms, is cut into the scansion’s syllables. Each syllable gets a median pitch, and a pitch at its start and at its end. All are given in semitones above the speaker’s median over the recording, so that 0 is the middle of the voice and +7 is a fifth above it.
The syllable times of the synthetic tracks are exact. Chamberlain’s were measured. The measurements here cover his lines 1–52; the Iliad line by line tab repeats them over 200 lines.
The four recordings at a glance
Measured
| Recording | Syllables measured | Median F0 (Hz) | Span, 5th–95th centile (st) | Accented syllable the word’s highest | Step up to the accent (st) | Step down after it (st) |
|---|---|---|---|---|---|---|
| Chamberlain, Iliad 1.1–52 | 775 | 134 | 14.1 | 94 of 190 (49%) | 0.5 (n = 109) | 2.1 (n = 168) |
| Sappho fr. 1, synthetic | 262 | 150 | 7.0 | 62 of 75 (83%) | 4.0 (n = 25) | 3.9 (n = 78) |
| Il. 1.1 slow, synthetic | 16 | 147 | 7.3 | 4 of 4 | 6.1 (n = 2) | 6.1 (n = 4) |
| Sappho 1.1–4 slow, synthetic | 11 | 148 | 7.0 | 3 of 3 | 7.0 (n = 3) | 5.6 (n = 2) |
The column “Accented syllable the word’s highest” looks at the words of two or more syllables that carry an acute or a circumflex. It counts the words in which the accented syllable has the highest median pitch. The test comes from the Seikilos song, where the acute is nearly always set on a higher note than any other syllable of its word.[1]
The “step up” is the accented syllable’s median pitch less that of the syllable before it in the same word. The “step down” is the same against the syllable after it. In the music of the Delphic paeans the step up is about 0.8 of a tone (1.6 semitones), and the step down about 1.3 tones (2.6 semitones), most of it on the very next syllable.[2]
Chamberlain: a light pitch accent
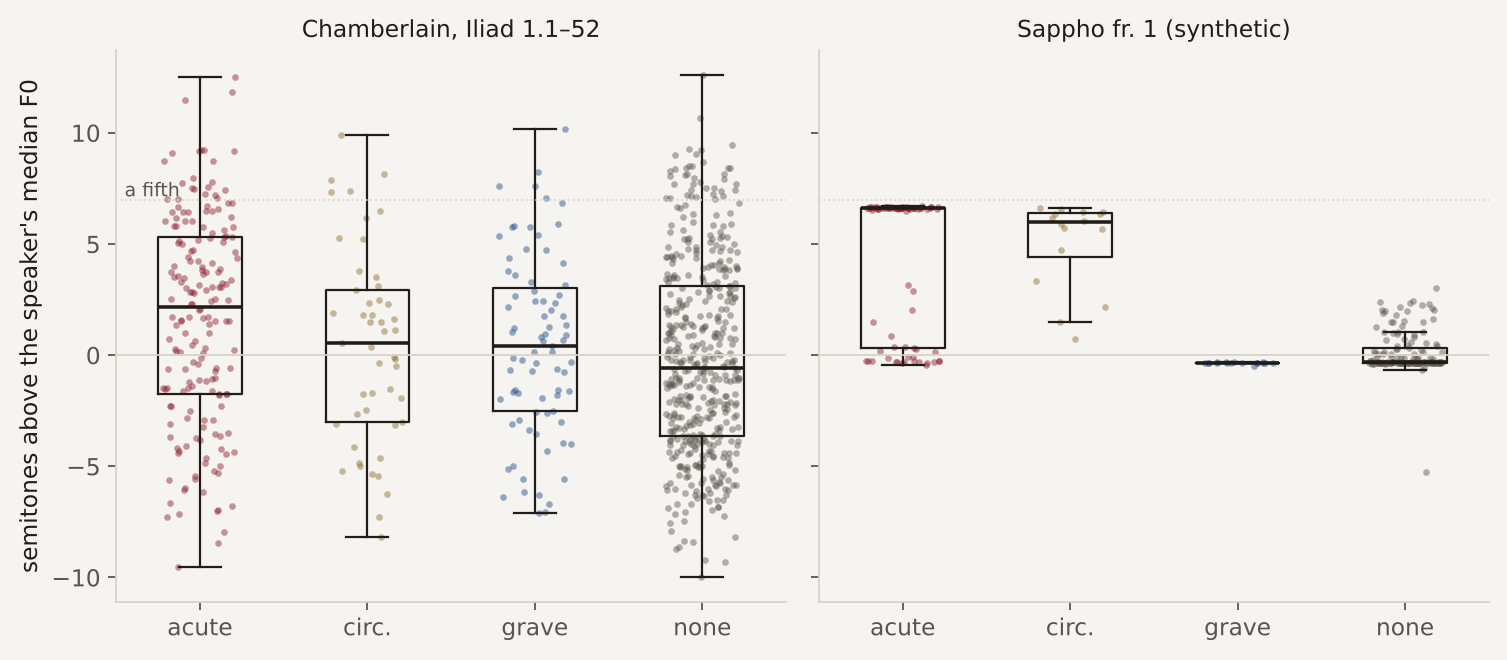
Measured
| Syllables | n | Median height (st) | Middle half | Movement inside the syllable (st) | Range inside the syllable (st) |
|---|---|---|---|---|---|
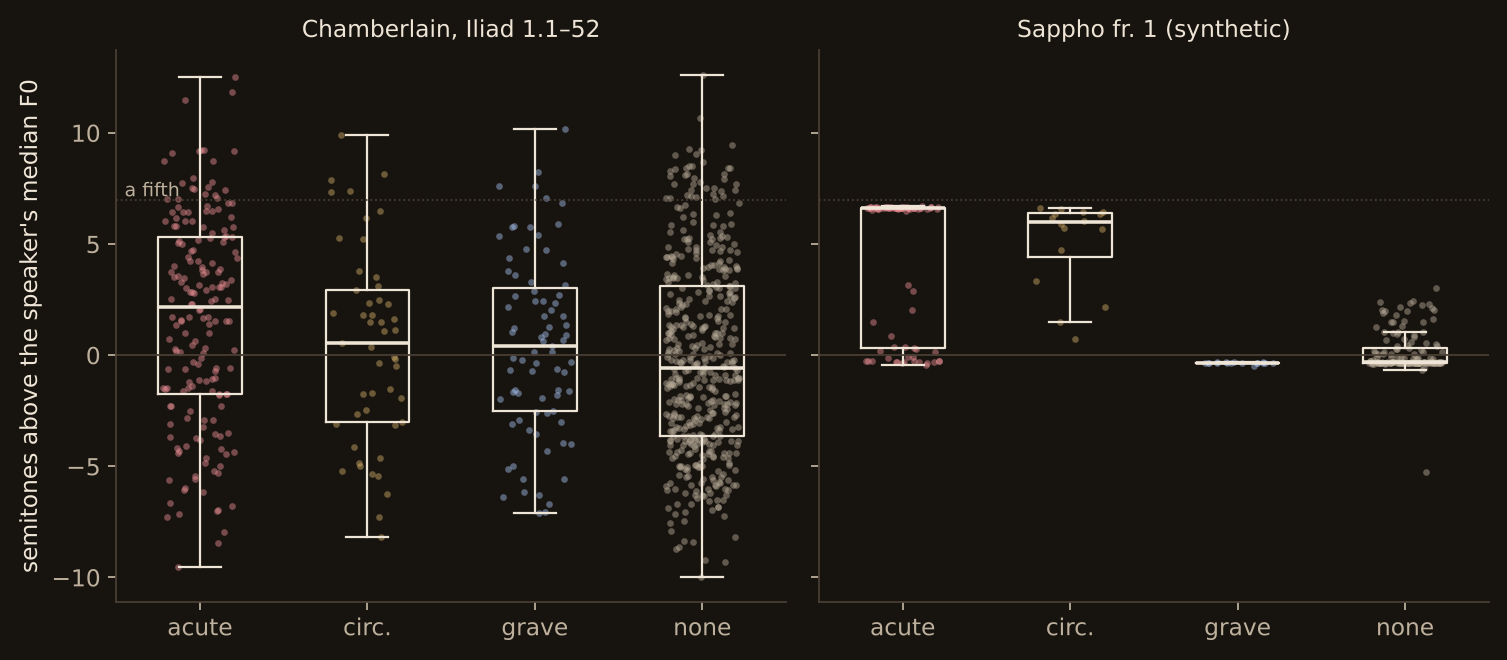
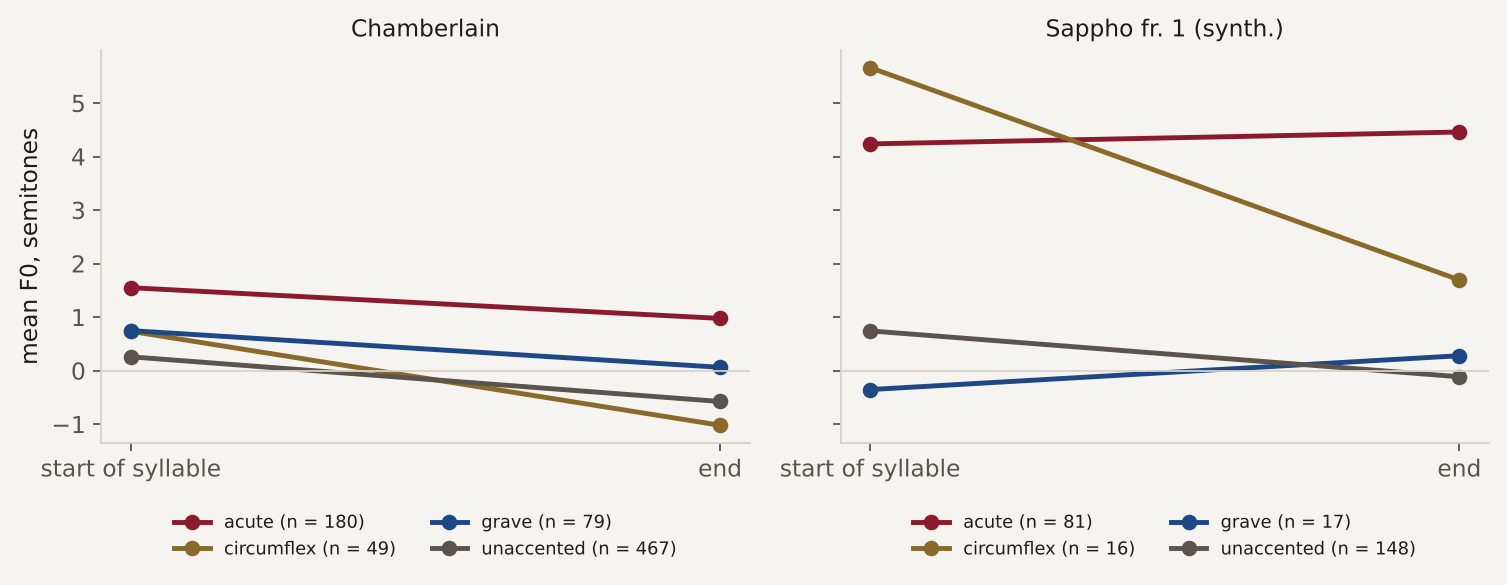
| acute | 180 | 2.2 | −1.7 to 5.3 | −0.57 | 5.0 |
| circumflex | 49 | 0.6 | −3.0 to 2.9 | −1.76 | 7.0 |
| grave | 79 | 0.4 | −2.5 to 3.0 | −0.69 | 4.4 |
| unaccented | 467 | −0.6 | −3.6 to 3.1 | −0.83 | 4.3 |
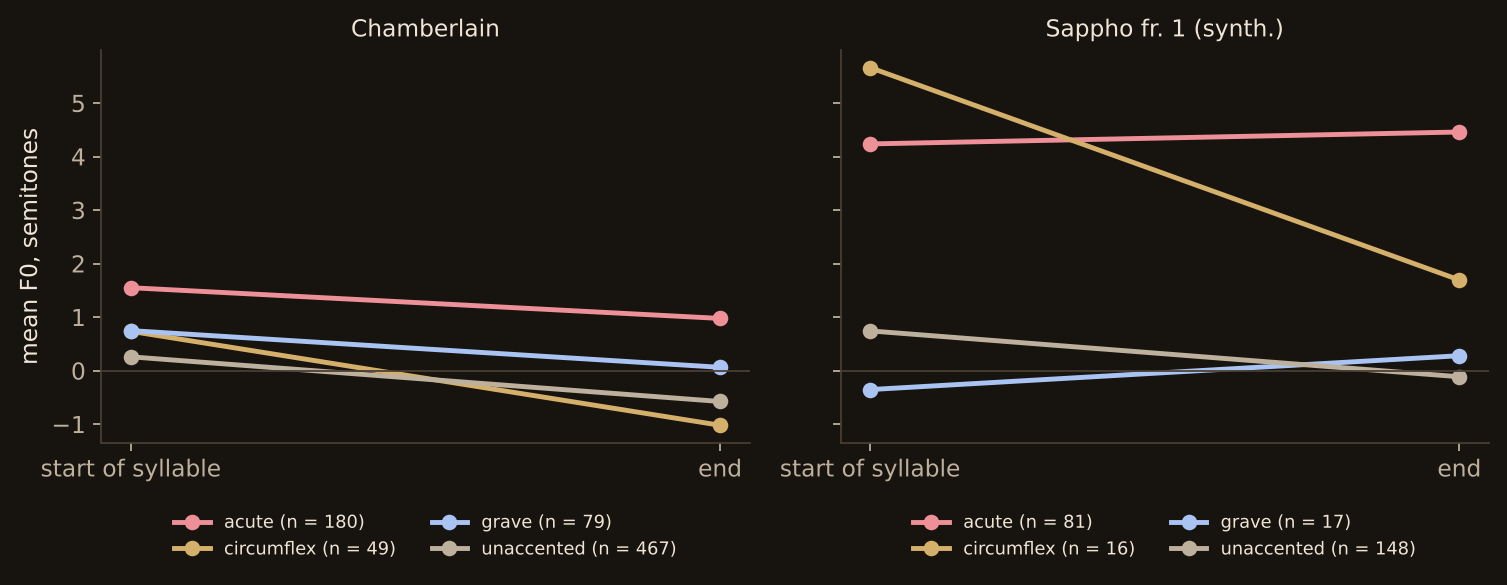
The reader’s acute syllables sit about 2.8 semitones above his unaccented ones, a little more than a whole tone. But the spread within each class is far wider than the difference between them, and only half the accented words peak on the accented syllable. This is what the recording’s note calls a light pitch accent. It is laid over the rise and fall of a reading voice that spans fourteen semitones, twice the fifth that Dionysius allows to speech.[3]
The grave is not low. At +0.4 it stands with the acutes, as it does in the music of the paeans, where the grave behaves as a lowered high.[4] The circumflex falls inside its syllable, by 1.8 semitones on average and by 3.4 in the lines whose syllable times are cleanest. It also has the widest range of any class. A circumflex is a high pitch followed by a fall on one long vowel.[5]
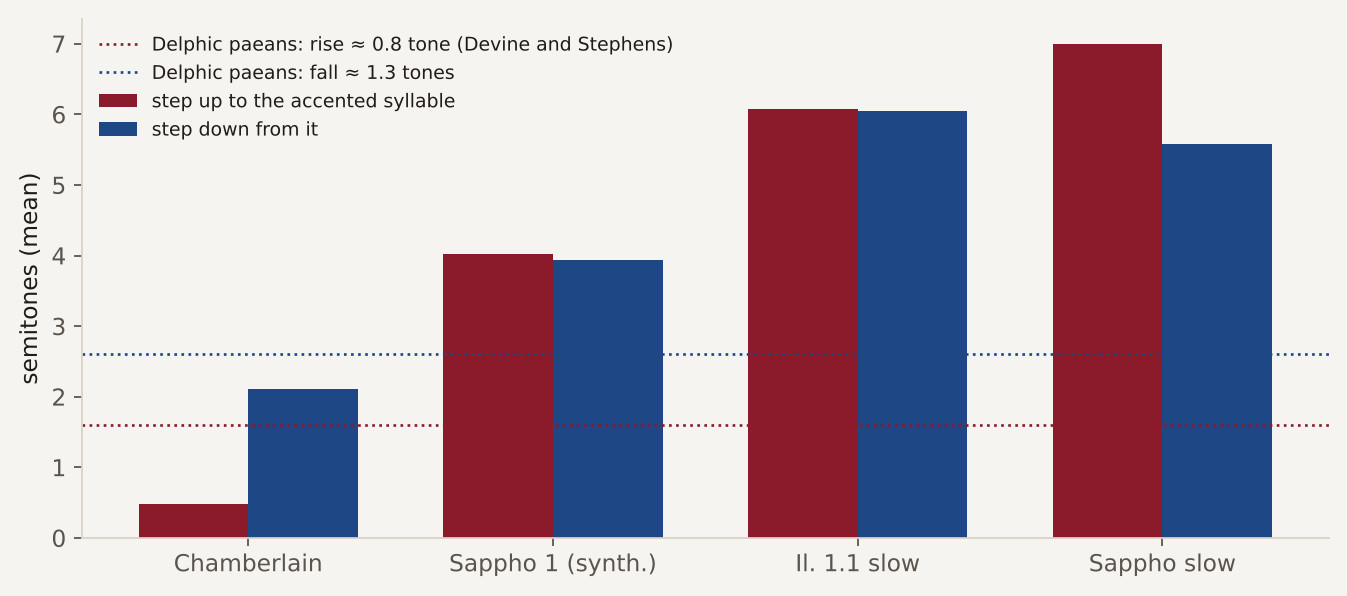
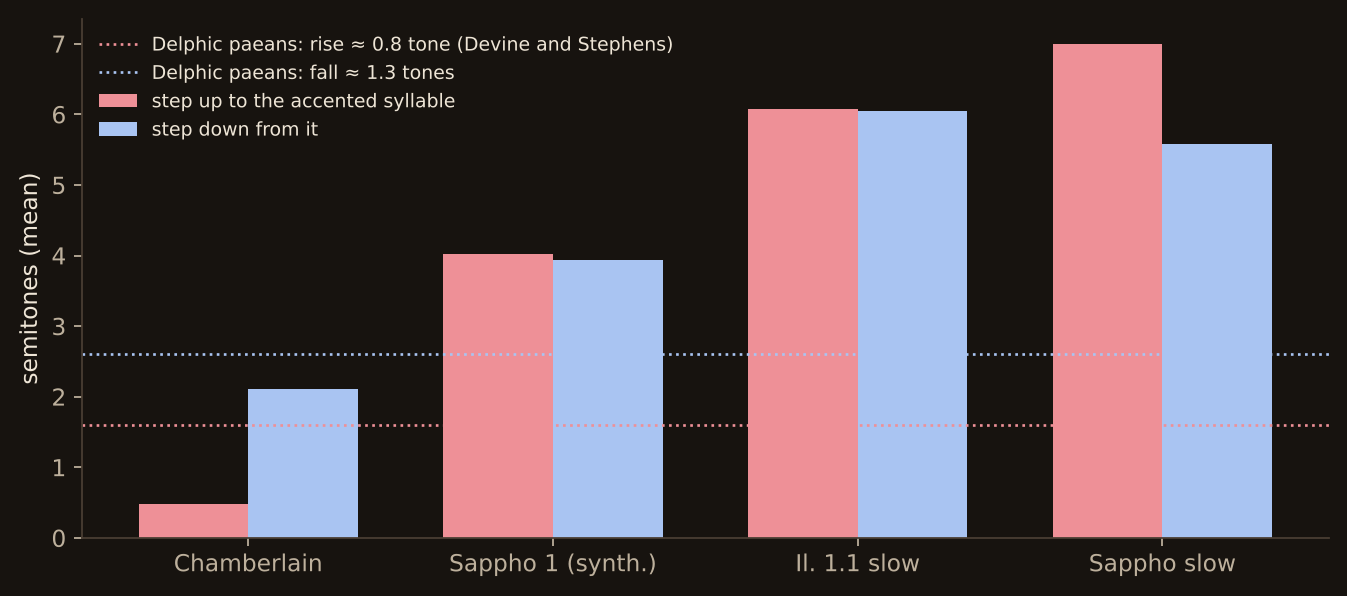
The steps are the closest point of contact with the ancient evidence. Chamberlain climbs half a semitone into the accent and drops two semitones after it. A small rise and a larger fall is also the shape found in the paeans. Dionysius describes the same movement as a gradual climb to the high and a return to low.[6] The fall is where this reader’s accent lives, and it holds over 200 lines.[7]
What the synthetic tracks show, and do not
Measured
| Syllables (Sappho fr. 1, synthetic) | n | Median height (st) | Middle half | Movement inside the syllable (st) | Range inside the syllable (st) |
|---|---|---|---|---|---|
| acute | 81 | 6.6 | 0.3 to 6.6 | 0.22 | 2.6 |
| circumflex | 16 | 6.0 | 4.4 to 6.4 | −3.97 | 5.9 |
| grave | 17 | −0.4 | −0.4 to −0.3 | 0.63 | 1.1 |
| unaccented | 148 | −0.3 | −0.3 to 0.3 | −0.86 | 1.4 |
The synthetic voice reproduces its rule and nothing else. Its acutes are a fifth up, which is the site’s reading of Dionysius’ fifth. Its circumflexes are high and then fall, its graves are low, and the syllable after an acute glides down from a middle pitch. The acutes that spread the range from 0.3 to 6.6 are those on long vowels. They are sung as a rise through the syllable, so their median lands in the middle. Measuring the track shows that the generator works and that Praat recovers steps of a fifth under a drone. It says nothing about Greek. It has two limits.
- Steps, not glides. The track moves between two notes, as song does, whereas speech glides.[8] Its fifth is the upper limit that Dionysius gives, used here as the normal step.
- The grave at the bottom. The rule sings a grave low. The ancient sources do not say what pitch the grave had.[9] In the music of the paeans it stands a third of a tone above the unaccented level.[4] Chamberlain’s graves are not low either.
The fall after an acute stays inside the word, or passes onto a following enclitic, but never crosses a word-end.[10] The track measured here is the render of 2026-10-18, which follows that rule.
The two slow demonstrations are the same model at half speed without the drone: acute +6.9 semitones, fall after it, everything else at 0.
How to read this against the Accent page
The measurements do not decide the questions that the Accent page marks as disputed. Greek had a pitch fixed in each word. In a language of the Japanese type, pitch is the accent’s only mark. In one of the Swedish type, the pitch is fixed but loudness and length take part too. The ancient evidence cannot decide which type Greek was.[11] An intensity trace is the one kind of evidence the grammarians could not give, and the browser lab lets a reader make one.
What the figures add is modest. A modern reader aiming at a pitch accent produces a small, mostly falling movement over a much larger sentence melody. A pitch accent can be heard without any step in loudness. And the synthetic voice is a diagram of the written accents. This is a personal view, but in 1968 Allen had heard no tonal recitation that convinced him, and he advised learners not to strive for one.[12]
Notes
- ^ Allen 1968, p. 109.
- ^ Devine and Stephens 1994, pp. 183–189.
- ^ Allen 1968, p. 109; Devine and Stephens 1994, pp. 171–172.
- ^ a b Devine and Stephens 1994, pp. 181–182.
- ^ Allen 1968, pp. 111–112; Devine and Stephens 1994, p. 193.
- ^ Allen 1968, p. 113.
- ^ See the Iliad line by line tab.
- ^ Allen 1968, p. 111.
- ^ Allen 1968, pp. 115–116.
- ^ Devine and Stephens 1994, p. 180; Allen 1968, pp. 115–117.
- ^ Probert 2006, pp. 55–57.
- ^ Allen 1968, p. 118.
6. Sound lab · 6 of 7
Quantity and duration
In the metrical tradition, and in this site’s synthetic tracks, a long syllable takes the time of two shorts.[1] The ancient writers on rhythm called the time of a short the χρόνος πρῶτος, the “first time”. Modern scholars call it the mora.[2]
Quantity is not simply duration, however. Dionysius observed that σπλήν takes longer to say than ἦ, though both syllables are heavy. He also observed that the light first syllable of ὁδός is quicker than that of στρόφος. Time alone, then, does not explain why one long equals two shorts.[3] Speakers seem to work with a feeling of long and short rather than with measured times, it has been argued that the two longs of a spondee were told apart, and some analyses count as many as seven degrees of quantity.[4] The ancient doctrine of the “irrational” long, worth more than one short but less than two, also suggests that heavy syllables were adjusted in length, though this evidence is indirect.[5]
This tab tests the convention on David Chamberlain’s reading of Iliad 1.1–52, 809 syllables in 52 lines. The Iliad line by line tab repeats the two tests over 200 lines.
Why the obvious measurement will not do
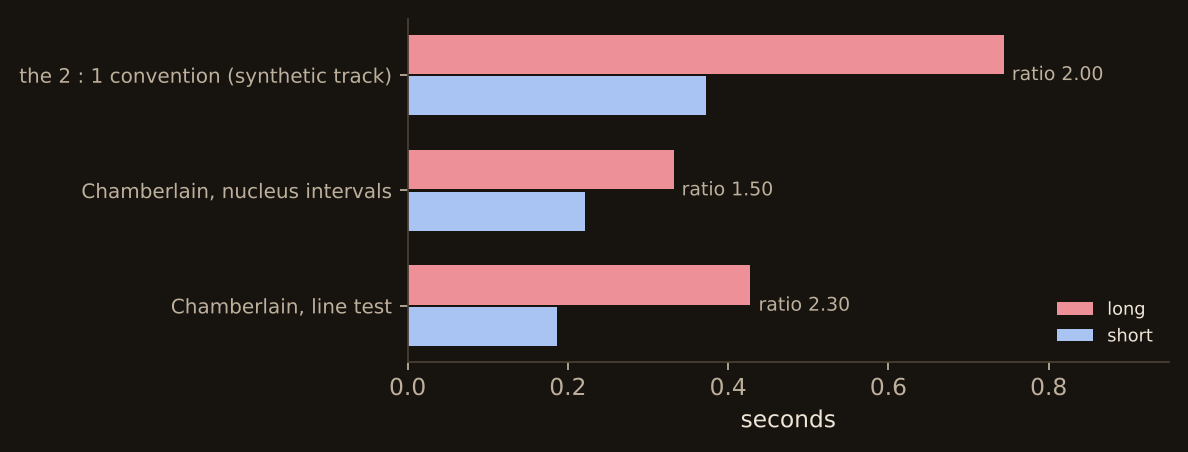
The obvious test would cut the recording into syllables and then average the longs and the shorts. That is circular unless the cutting is independent of the answer, and no automatic cutting of connected Greek speech is. The syllable times on the previous tab started from the 2 : 1 convention as a guess and were then moved to the nearest dip in loudness. A trial run with equal shares as the guess gave a ratio near 1 : 1 instead. Those times inherit the guess, so they cannot test it. Two measurements avoid the problem.
The line test
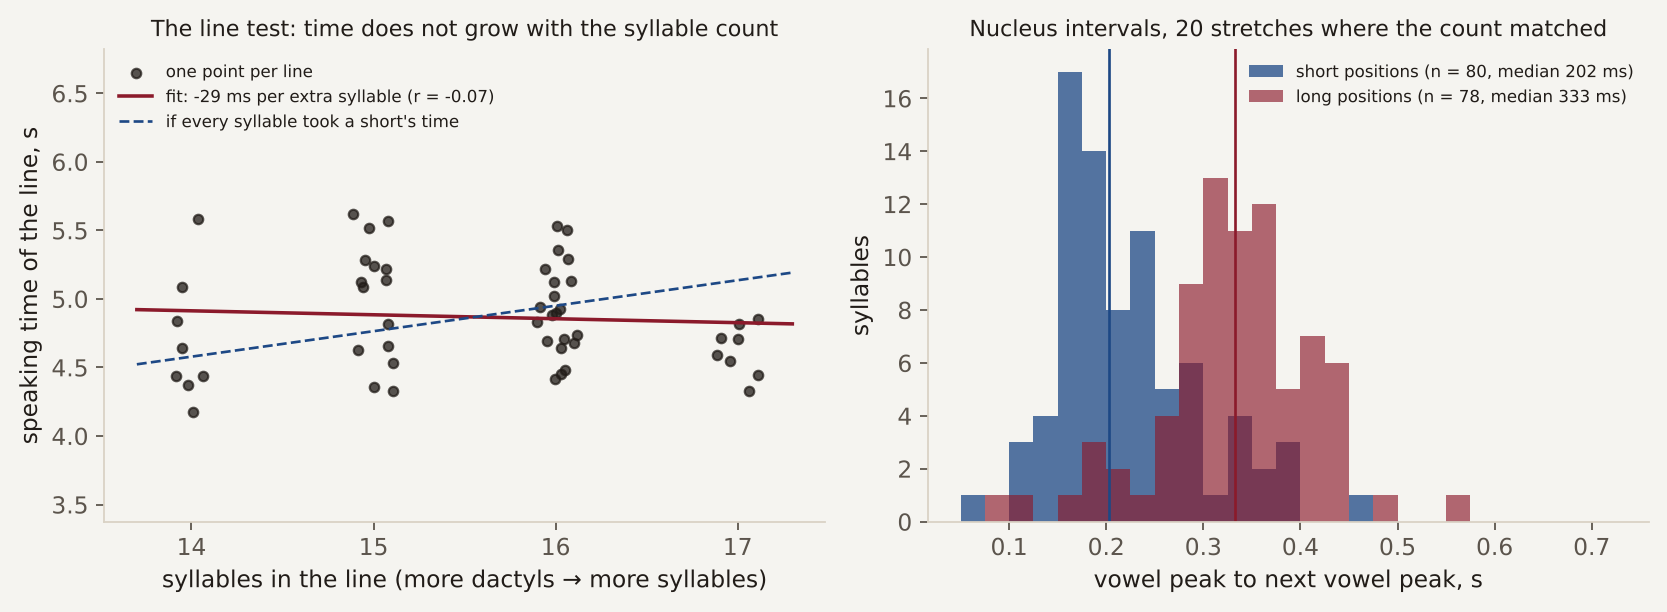
Measured A hexameter has twelve positions. Five of them, the bicipitia, may each hold one long syllable or two shorts.[6] A line therefore has 13 to 17 syllables, and Chamberlain’s 52 lines have 14 to 17. If a long took exactly twice a short, every line would take the same time, whatever its number of syllables. If syllables were nearer equal, a line of 17 syllables would take longer than one of 14. The speaking time of each line, which is its span less the pauses inside it, was fitted against its numbers of long and short syllables.
| Syllables in the line | Lines | Mean speaking time (s) |
|---|---|---|
| 14 | 8 | 4.70 |
| 15 | 15 | 5.01 |
| 16 | 21 | 4.93 |
| 17 | 8 | 4.62 |
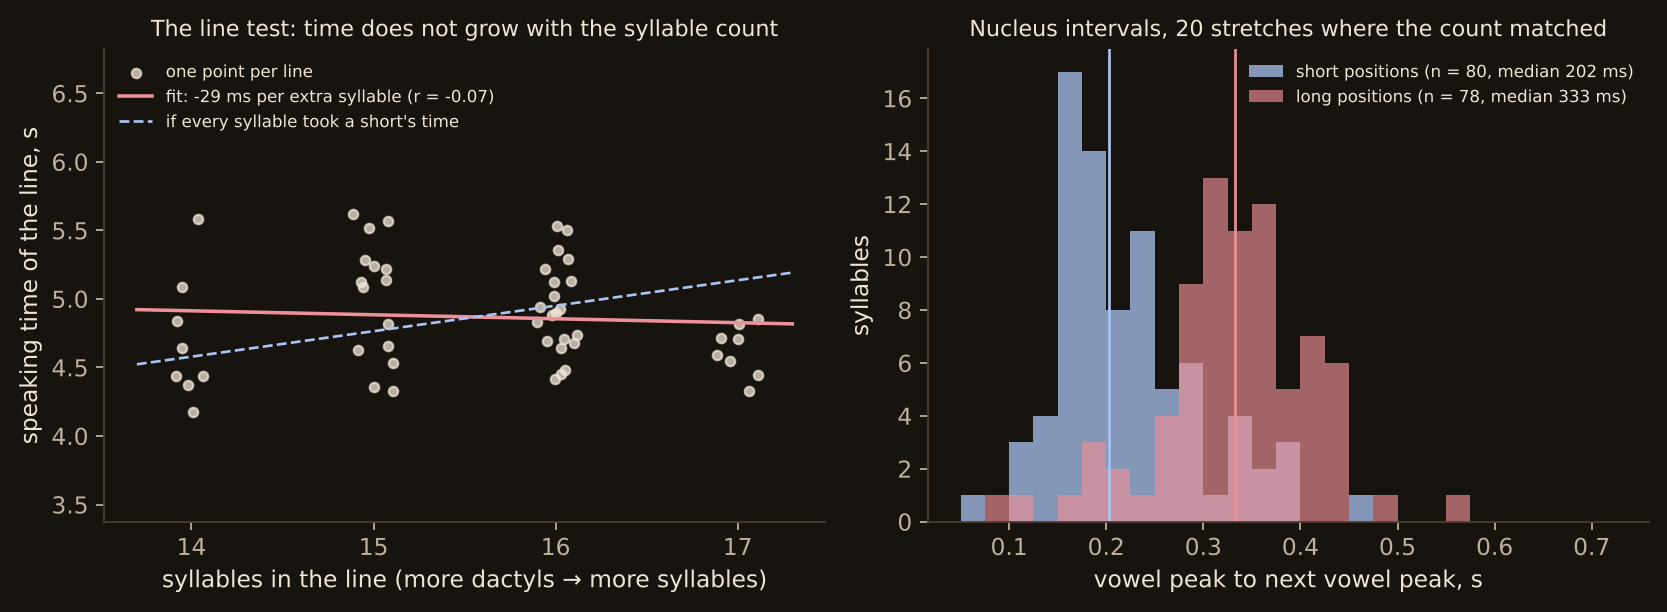
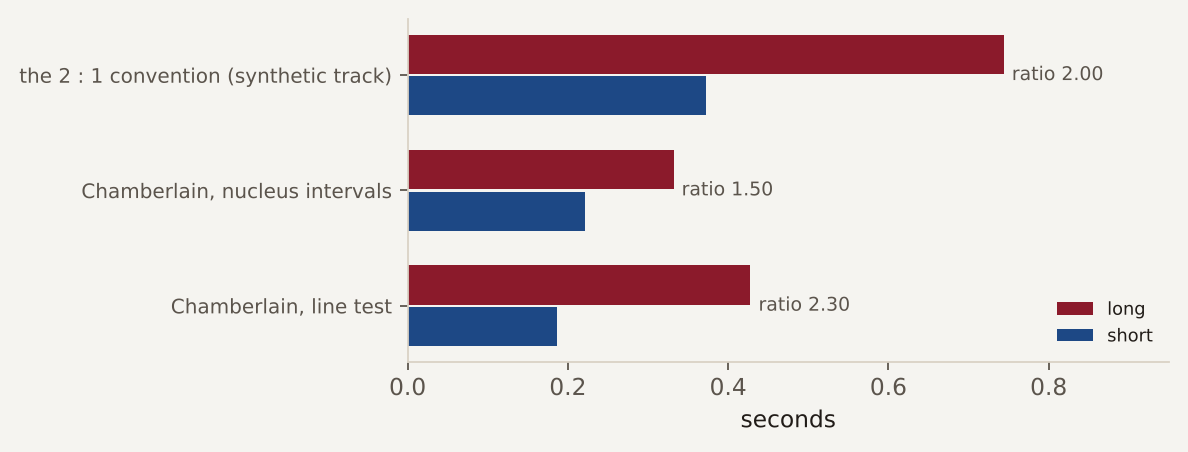
A line takes 4.87 s on average, with a standard deviation of 0.38 s. Its time does not rise with the number of syllables: the fitted slope is −29 ms for each extra syllable, with a correlation of −0.07. Fitting time = (longs × dL) + (shorts × dS) gives dL = 428 ms and dS = 186 ms. That is a ratio of 2.3 : 1, with a 95% bootstrap interval of 1.8 to 3.1. At this tempo the line runs at 4.9 morae a second, so a short lasts about 200 ms. Chamberlain keeps the line’s time constant whatever its syllables, which is what a 2 : 1 reading does. The note on the recording says that he keeps a regular hexameter beat throughout.
The nucleus test
Measured The second measurement uses no starting guess. Praat’s intensity contour peaks once in each syllable’s vowel. These peaks, in voiced frames, are the syllable nuclei.[7] There are 20 stretches, parts of 17 lines between pauses, where the number of peaks equals the number of syllables in the scansion. In them each peak belongs to one syllable, and the interval to the next peak is that syllable’s time from its vowel to the next.
| Nucleus to nucleus (Chamberlain) | n | Mean (ms) | Median (ms) | Middle half (ms) |
|---|---|---|---|---|
| long positions | 78 | 332 | 333 | 296–379 |
| short positions | 80 | 221 | 202 | 165–255 |
Measured this way the ratio is lower: 1.5 : 1 by the means and 1.6 : 1 by the medians. The two tests measure different things. The line test asks how the reader shares out the time of the whole line, and finds 2 : 1 or a little more. The nucleus test asks how far apart the vowel peaks fall, and finds the longs well short of double.
Part of the difference lies in the consonants. A syllable long by position ends in a cluster of consonants, whose time falls between the peaks but belongs, to the ear, to the long syllable. The rest is the point made at the top of this tab: a heavy syllable need not be twice as long as a light one to count as two morae.[3] This reader keeps the metre audibly, yet does not make his longs double from vowel to vowel.
Pauses and the caesura
Measured Praat found 26 pauses of a quarter of a second or more inside the 52 lines, in 24 of them, 14.5 s in all. Most fall at the caesura, as after θεὰ in line 1, πᾶσι in line 5 and θύγατρα in line 13, or at a mark of punctuation. Line 27 has two, on either side of the second ἢ. The speaking times above leave them out. The reader’s pauses, like his beat, follow the verse.
The synthetic tracks
The site’s sung tracks are not evidence here but a ruler. Every short lasts 0.372 s and every long 0.744 s, exactly 2 : 1, with the frame drum on the longs, a tap on the shorts and a pulse on every unit. The slow Start-here tracks use 0.5 and 1.0 s. Hearing Chamberlain beside them is the quickest way to feel the difference between the convention and a reading that keeps time by the line.
Notes
6. Sound lab · 7 of 7
Try it yourself
This is a small phonetics lab that runs in your browser. Nothing is uploaded, and it works from a saved copy of the page and on a phone. Allow the microphone when asked. If there is none, or you refuse, the test signal stands in for it, so that you can see how the traces behave. Everything is measured in semitones from a reference, which is the middle of your voice. A fifth is 7 semitones, and a whole tone is 2.
Record and see your pitch
Microphone off.
The pitch tracker uses the YIN method.[1] It looks at windows of 85 ms about sixty times a second. A low voice near 70 Hz, or a very breathy sound, may drop out. Chrome, Firefox and Safari all work. On a phone the page must be opened as a file or over https for the microphone to be offered. The targets from the recordings are measured contours of real syllables, in semitones from that speaker’s middle. Play one, then copy its shape rather than its exact notes.
Pitch without stress
- Choose the target acute: a rise of a fifth, press Play the target and listen.
- Record, and sing or say a long ah that starts low and rises to the target’s height, keeping your voice at one steady loudness.
- Read the score: the pitch should move by several semitones while the loudness varies by less than about 3 dB. Then try the circumflex (rise then fall on one vowel) and the Delphic shape, a small rise and a larger fall.
A pitch accent is carried by pitch alone, while a stress adds length and loudness.[2] An acute is a rise. A circumflex is a high pitch followed by a fall. In speech both are glides rather than steps.[3] The pitch of the grave is not known.[4] English speakers raise their loudness with their pitch without noticing it. That is why the lab draws a loudness trace under the pitch.
The hexameter tapper
Tap once per syllable, giving each long the time of two shorts.[5] After the last syllable the lab reports your ratio of long to short and how even your taps were. The second line is Iliad 1.1, with its two spondees. The Chamberlain tempo is the one measured on the Quantity tab.
Tones and intervals
Each button plays the base note and then the note the interval above or below it. The fifth and the fourth are the pure ratios 3 : 2 and 4 : 3. Dionysius keeps the melody of speech within about a fifth.[6]
The Delphic figures are measured from the music of the Delphic paeans. The melody rises about a third of a tone to a grave and nearly a tone to an acute. It falls about 1.3 tones after the accent, and two whole tones onto an enclitic.[7] An enclitic is a small word that leans on the word before it and usually has no accent of its own.
The base note, 146.83 Hz, is the D3 of the site’s sung tracks; set your own low note instead. A tonal reading is hard to make convincing.[8] The lab is for hearing how large the intervals are.
